Building decarbonization is a rapidly evolving policy area, shaped by ongoing debate among decision makers and an expanding set of issues. The Spotlight States dashboard, which is now free and open to the public like all of Buildings Hub, tracks proposed legislation and enacted policies related to building decarbonization and electrification across 29 states and Washington, D.C. These include incentives offered by the major investor-owned utilities in each jurisdiction serving most residential and commercial customers. We track legislation through LegiScan, while data on policies not originating from legislation comes from state websites, utility websites, and press releases. As of June 1, 2026, the dashboard tracks 686 enacted policies from 2015 to 2026, 28 of which were passed in the last 12 months. This is compared to 52 bills that failed or were withdrawn and 276 that are still under consideration.
In this Data Story and on the dashboard, definitions for the types of state policies are as follows:
- Legislation: Introduced bills; will only ever refer to proposed legislation that has not yet been enacted.
- Policy: Inclusive of enacted bills, active utility policies and programs, and Executive Orders.
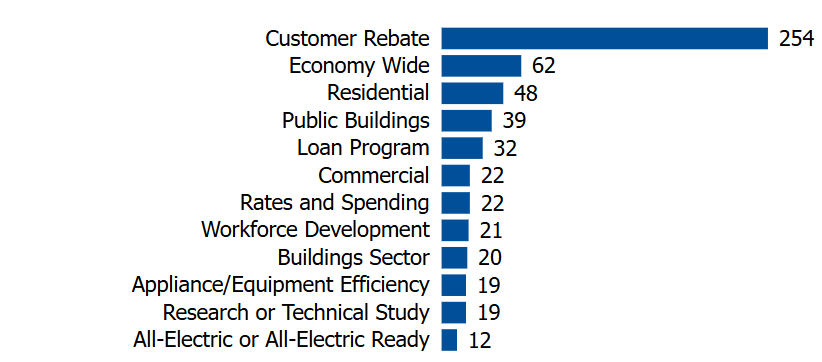
Customer rebates are the most common policy type across states
The number of policies enacted in each state varies across our Spotlight States (Figure 1). California has enacted the most at 67. These ranged from state-run incentive programs for electrification to a solar program for multifamily buildings to embodied carbon standards for construction materials. Washington comes in at number two with 51 policies, followed by Colorado and New York with 49 each. The number of policies does not necessarily represent a greater focus on building energy or better policy. It may reflect the priorities of the legislature or utility or the salience of building decarbonization at a given time.
The District of Columbia is counted as a state.
Source: Atlas Buildings Hub Spotlight States Policy Dashboard.
Atlas tracks 47 types of policies on the dashboard. Across the Spotlight States, the most common policy type is a customer rebate, typically for installing energy efficient appliances (Figure 2). These are often offered by utilities, but some states including Maine, Oregon, and Washington, D.C. offer incentives through state-run efficiency programs or utilities. Definitions and scope for each of these policy areas can be found on the dashboard’s Methodology.
Figure 2: Enacted Policies by Type in Spotlight States, 2015-2026
As of June 1, 2026, the Spotlight States dashboard tracks 276 bills under consideration across 23 states and 11 active sessions (Figure 3). New York tops the list with 51 pieces of legislation under consideration, followed by New Jersey at 43. These range from building codes to workforce development programs to thermal energy network pilot programs. 42 of these proposed bills specifically concern residential buildings, including several bills that aim to boost savings via better efficiency through weatherization programs, green building standards, or smart thermostats.
Policy statuses are automatically generated and updated via LegiScan. The District of Columbia is counted as a state.
Source: Atlas Buildings Hub Spotlight States Policy Dashboard.
Comparative analysis reveals varying state environments
A new feature of the Spotlight States dashboard, the Analysis tab, allows users to compare the policy environments of two states. For example, let’s compare electrification incentives in Maine and California.
The Analysis tab allows users to look at scope of state-administered rebates for different technologies in each state. As shown in Figure 4, both states have programs that offer incentives for installing high-efficiency technologies like heat pumps, battery storage, or heat pump water heaters.
Figure 4: Comparing Policy Environments in California and Maine
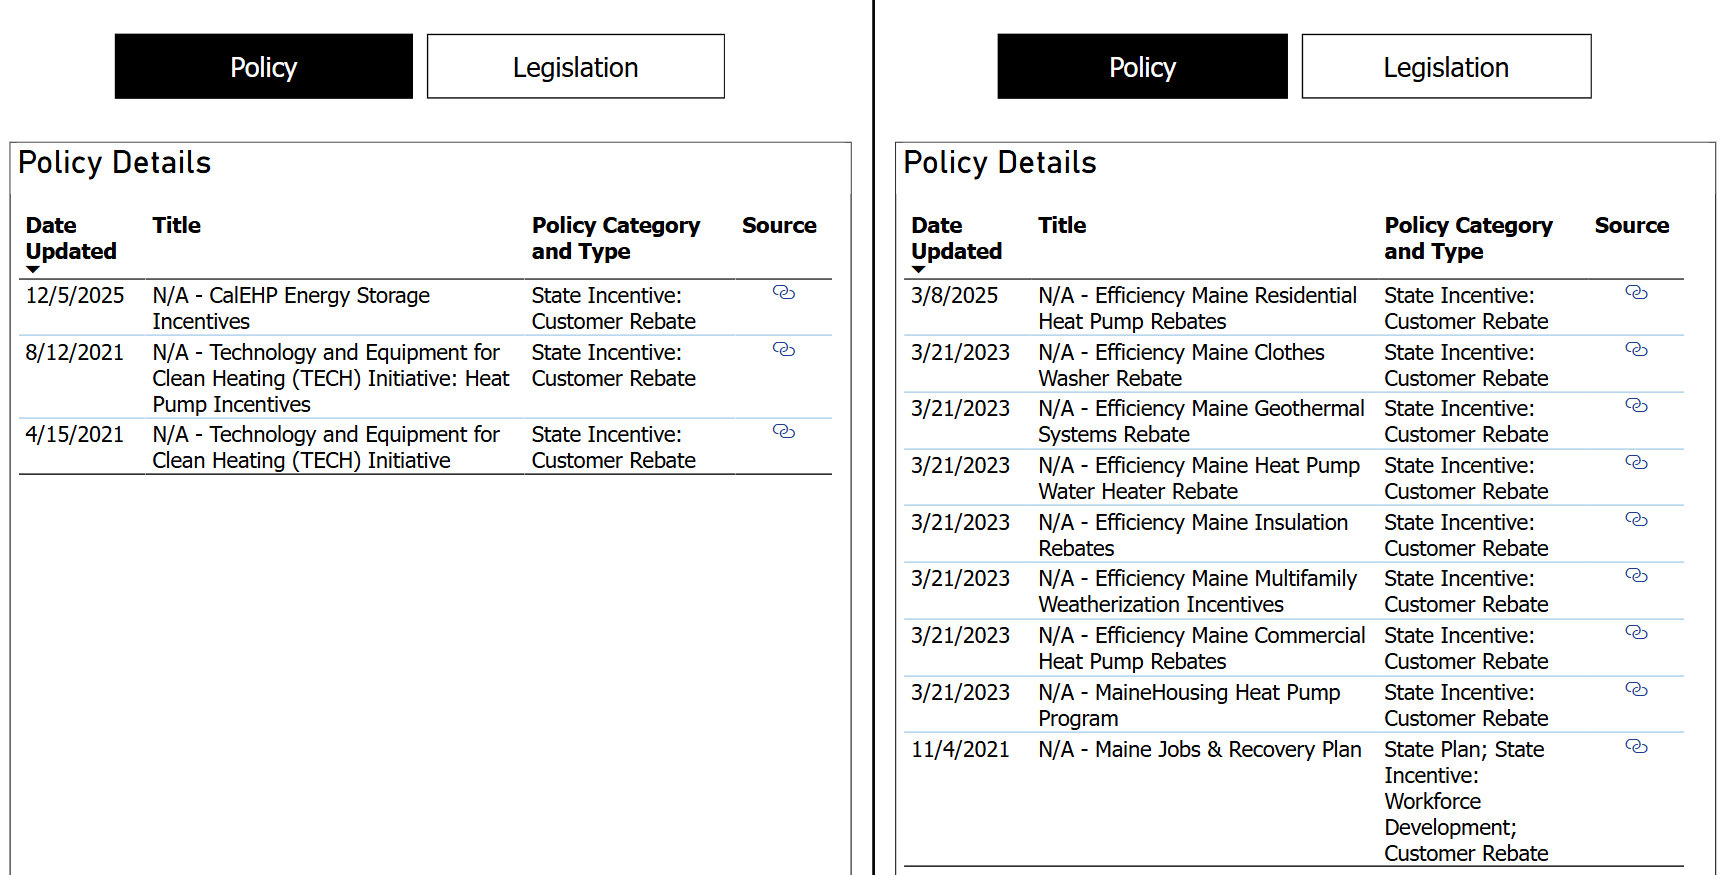
If a user wanted to dig deeper into the details of specific programs, those are available on the Analysis page as well. For example, we can examine the details of the Efficiency Maine Residential Heat Pump Rebates in Maine alongside those of the Technology and Equipment for Clean Heating Initiative’s single-family heat pump incentive in California. The two incentives offer relatively similar structures: each provides a base incentive of $1,000 per heat pump with additional funding for low-income households. But while incentives are capped at two heat pumps per home in California (with an additional $2,500 for one unit in low-income households), Maine allows for three units per household with higher incentives for low-income households applicable to all three units. This is likely because California has a much higher proportion of central heat pumps—74 percent of all heat pumps in the state are central heat pumps, and they typically require only one unit per household. In Maine, however, mini-splits are much more common—89 percent of heat pumps in the state are mini-splits—and those often require more than one unit per household.
The Analysis page also brings in additional information from other Buildings Hub dashboards, including the Residential Building Characteristics and Market Factors dashboards. When a user chooses a state from the drop-down menu, the dashboard displays the number and share of households with solar power in 2020, the number and share of households with heat pumps in 2020, and monthly fuel prices over time in that state. These statistics provide insight into the market context in which states are making decisions. For example, markedly rising electricity prices and higher peaks of residential gas prices can help explain why states are turning even more heavily to the question of affordability lately. Combining the policy and market environments allows users to understand not only how different states are approaching building decarbonization but also how their market environments affect their strategies.
Atlas is working to demystify the state policy landscape
Building decarbonization and electrification have become even more salient topics in the years since Buildings Hub began tracking policy developments in 2021. This redesign is intended to help users to more quickly and easily get the information they need along with the context they can use to understand it.
If you are reading this, we would love to hear from you. Buildings Hub will be sending a user survey to our mailing list in the next few weeks and will be promoting it on our site. Please share your feedback on this new dashboard, whether it helps you find what you need more readily, and what else you’d like to see. Now that the Buildings Hub is free and open to the public, we hope to be able to engage with even more users who can benefit from the data we offer and use it to drive smart building decarbonization and electrification across the country.