This data story was written by Stephen Naimoli and Jaclyn Lea.
Switching from fossil fuels to heat pumps for space and water heating and upgrading to induction cooking should help lower electricity bills thanks to superior efficiencies. However, as electricity prices increase, the gains from efficiencies decrease or disappear.
Last quarter, the Atlas Buildings Hub team published a story on what Americans pay for heating and cooking in our homes, using data from the 2020 Residential Building Characteristics dashboard. That story also gave a brief refresher on how the current building stock uses energy and how it has evolved over time. This quarter, we will dive into the data on how much energy we use for those activities and why it’s important.
Household energy consumption is determined by factors such as climate, appliance efficiency, and income (as higher-income households tend to have more appliances to use and more space to condition). The U.S. Energy Information Administration (EIA) reports energy consumption in British thermal units, but for ease of interpretation, we have converted all energy consumption data to kilowatt-hours (kWh).
Building on last quarter’s insights, we will dive deep into the survey’s energy consumption data within three primary residential building activities: space heating, cooking, and water heating.
Space Heating Energy Consumption and Expenditures Are Directly Related
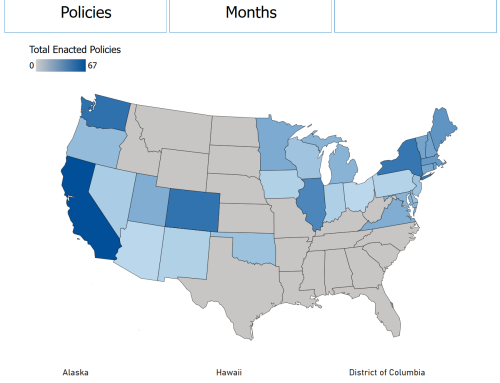
Space heating uses the most energy of the three end uses discussed in this story. On average, households used the equivalent of between 20 and 23,139 kWh for the year 2020 to heat their homes (Figure 1). A few regional differences exist, chiefly that consumption is lower per household across the southern half of the country. This is likely driven by lower demand for space heating in warmer climates, although it should be noted that households in the South face higher energy burdens driven partially by high cooling needs and a lack of progress on energy efficiency. A future data story will focus on space cooling.
Figure 1: Space Heating Consumption Per Household by State, 2020
Source: Atlas Buildings Hub, 2020 Residential Building Characteristics dashboard. | Color saturation represents the total space heating energy consumption in a state. The darker the blue, the higher the consumption.
At the national level, the average household with electric heating used about 3,400 kWh in 2020, whereas the average household heating with gas used about 14,000 kWh. Houses heated with propane used an average of 15,000 kWh and fuel oil required about 19,000 kWh per household. In all five states with the highest space heating energy consumption per household in 2020, piped gas dominates (Table 1). It is the most used fuel for space heating in Illinois (78 percent), Michigan (77 percent), Wyoming (71 percent), Minnesota (68 percent), and Alaska (57 percent). These are also all in the top half of states for expenditures.
Table 1: Average Annual Energy Consumption for Space Heating Per Household in Top 5 and Bottom 5 Most Energy-Intensive States, 2020
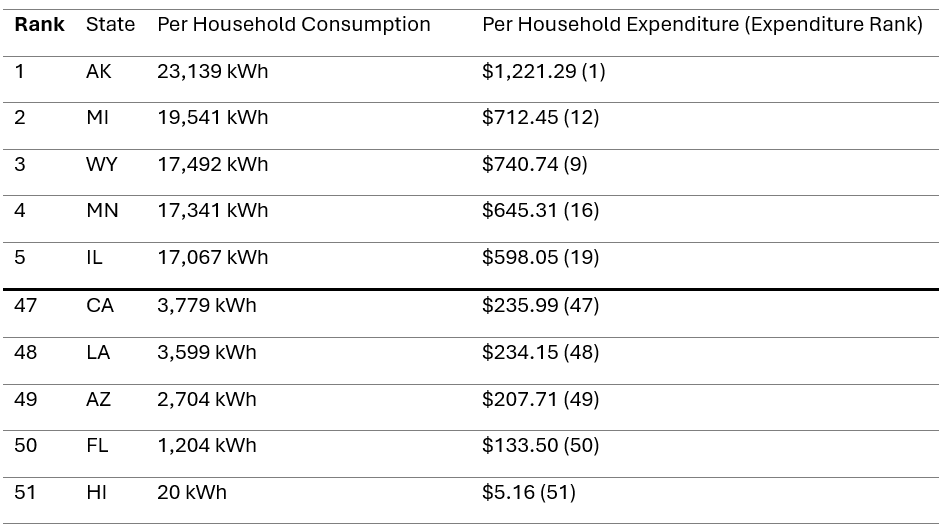
Source: Atlas Buildings Hub, 2020 Residential Building Characteristics dashboard. | State data is inclusive of the District of Columbia.
Three of the five states with the lowest consumption per household are dominated by electricity use for space heating. Electric heating equipment is used in 66 percent of Florida households, 62 percent of Louisiana households, and 51 percent of Arizona households. Hawaii stands out as a state where 94 percent of households do not use heating equipment, but most of those who do heat with electricity. In California, gas heats 64 percent of households. Notably, these five states are also the five least expensive states for space heating, as highlighted in the previous data story. Overall, there is a direct correlation when it comes to space heating – higher energy consumption leads to higher expenditures, while lower energy consumption leads to lower costs. Cooking, however, presents a different picture which we discuss in the next section.
Figure 2: Space Heating Equipment Stock Breakdown by Fuel Among Five Highest and Five Lowest Consumption States for Space Heating, 2020
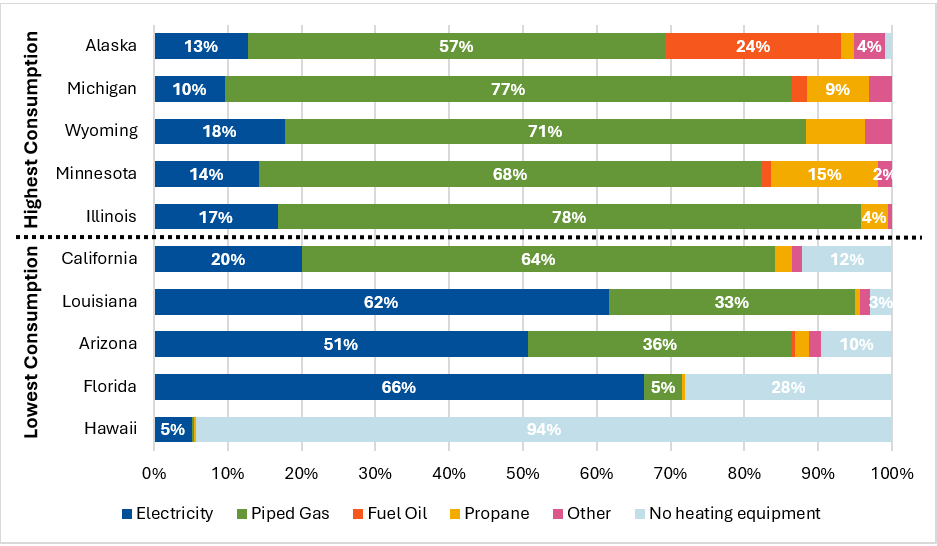
Source: Atlas Buildings Hub, 2020 Residential Building Characteristics dashboard. | State data includes the District of Columbia.
New Jersey and New York Use the Most Energy for Cooking
Cooking is the least energy-intensive of the three end uses discussed in this story. On average, households used between 292 kWh and 548 kWh for the year 2020 to cook in their homes (Figure 3).
Cooking energy consumption per household varies across states. New Jersey has the highest cooking energy consumption at 548 kWh per household, followed by New York at 539 kWh per household. The lowest consumption is in Florida at 292 kWh per household.
In the United States, 59 percent of households use electric-only cooktops. Electric cooktops are most prevalent in the Southeast and the Upper Midwest. Homes that do not use electric cooktops use gas, propane, or a mix of electricity and gas.
Figure 3: Cooking Energy Consumption Per Household by State, 2020
Source: Atlas Buildings Hub, 2020 Residential Building Characteristics dashboard. | Color saturation represents the total cooking energy consumption in a state. The darker the blue, the higher the consumption.
At the national level, the average household with an electric cooktop consumed 290 kWh for the year 2020, whereas the average household with a gas cooktop consumed 660 kWh. On average, households using propane stoves consumed 656 kWh, while those using a mix of electricity and gas consumed 479 kWh.
Illinois had relatively high cooking energy consumption per household, yet its expenditure ranks among the lowest (47th), as indicated in Table 2. Although Hawaii ranked among lowest in cooking energy consumption (50th), it had the second highest expenditure per household. This is due to the island’s remoteness and its heavy reliance on imported fuel, primarily petroleum, for generating electricity, which drives up costs.
Table 2: Average Energy Expenditures and Consumption for Cooking Per Household in Top 5 and Bottom 5 Most Energy-Intensive States, 2020
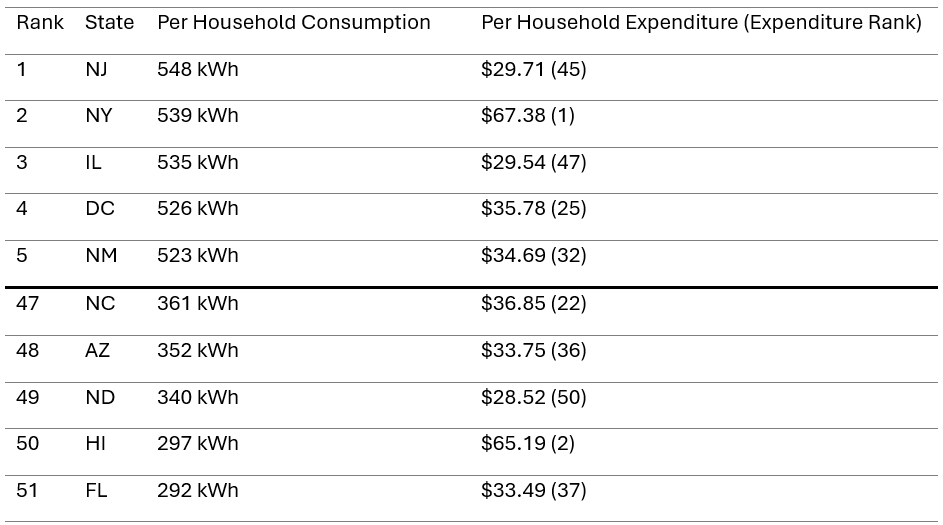
Source: Atlas Buildings Hub, 2020 Residential Building Characteristics dashboard. | State Data includes the District of Columbia.
In all five states with the highest cooking energy consumption per household in 2020, piped gas dominates (Figure 4). Piped gas is the most used fuel in New Jersey (57 percent), Illinois (56 percent), D.C. (52 percent), and New York (49 percent). In New Mexico, electricity and piped gas consumption is largely the same, with only a two percent difference between the two fuel types.
Electricity is the dominant fuel type used for cooking in the five states with the lowest energy consumption including: Florida (83 percent), North Dakota (81 percent), North Carolina (77 percent), Hawaii (72 percent) and Arizona (60 percent). While cooking accounts for the least amount of energy used compared to space heating and water heating, the variation across states highlights how fuel types and regional differences shape consumption.
Figure 4: Cooktop Stock Breakdown by Fuel Among Five Highest and Five Lowest Consumption States for Cooking, 2020
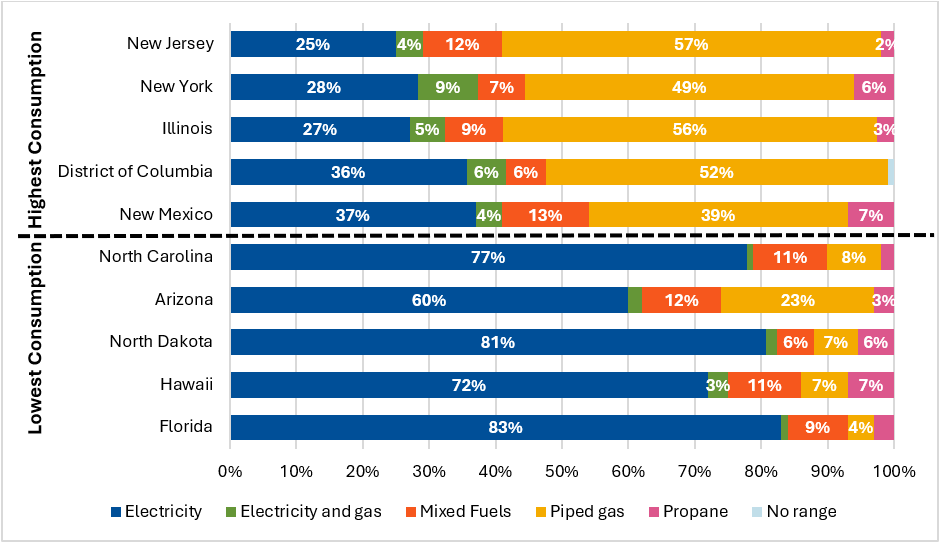
Source: Atlas Buildings Hub, 2020 Residential Building Characteristics dashboard. | State Data includes the District of Columbia.
Electric Water Heaters Use Far Less Energy Than Their Fossil Fueled Counterparts
Water heating uses more energy than cooking but less energy than space heating in the United States. On average, households used between 2,168 kWh and 7,150 kWh in 2020 to heat water in their homes (Figure 5).
In the United States, 46 percent of households use electricity to heat their water. Electric water heaters are most prevalent in the Southeast. Most homes that do not use electric water heaters use gas, propane, or fuel oil, but a few homes use solar, wood, or other sources.
Figure 5: Water Heating Energy Consumption Per Household by State, 2020
Source: Atlas Buildings Hub, 2020 Residential Building Characteristics dashboard. | Color saturation represents the total water heating energy consumption in a state. The darker the blue, the higher the consumption.
At the national level, the average household using electric water heaters used 2,700 kWh in 2020, while the average household using gas water heaters used 5,300 kWh. Those using propane consumed 5,000 kWh and households using oil for water heating consumed 6,000 kWh. In all five states with the highest per household water heating energy consumption in 2020, piped gas dominates (Table 3). Gas water heaters are used in 83 percent of Utah households, 70 percent of New Jersey households, 52 percent of Alaska households, 52 percent of Montana households, and 50 percent of Idaho households.
Table 3: Average Energy Consumption for Water Heating Per Household in Top 5 and Bottom 5 Most Energy-Intensive States, 2020
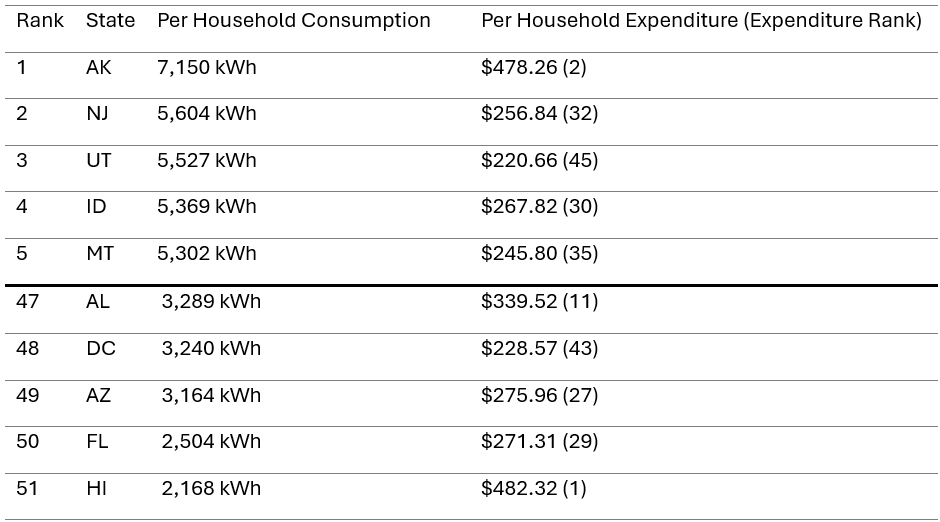
Source: Atlas Buildings Hub, 2020 Residential Building Characteristics dashboard. | State Data includes the District of Columbia.
All five states with the lowest consumption predominantly use electricity for water heating. In Florida, 88 percent of households heat their water with electricity, alongside 72 percent in Alabama, 66 percent in Hawaii, 55 percent in Arizona, and 52 percent in Washington, D.C. Unlike space heating, there does not appear to be a strong relationship between consumption and cost for water heating. For example, while Utah had the third highest consumption, it ranked 45th in expenditure. Conversely, Hawaii consumed the least energy but paid the most. But this also does not imply that gas water heating is cheap and electric water heating is expensive across the board. Washington, D.C., where more than half of households are served by electric water heating, ranked 47th in consumption and 43rd in expenditure. This does, however, highlight that states with low consumption and high expenditures require solutions to bring down the cost of energy in their homes.
Figure 6: Water Heating Stock Breakdown by Fuel Among Five Highest and Five Lowest Consumption States for Water Heating, 2020
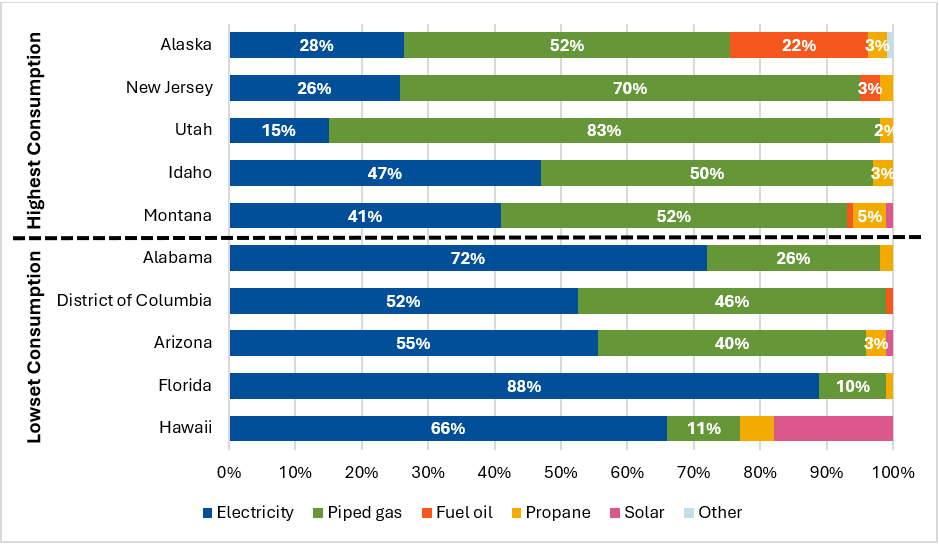
Source: Atlas Buildings Hub, 2020 Residential Building Characteristics dashboard. | State Data includes the District of Columbia.
Reduce Energy Consumption to Reduce Costs
Much of the time, expenditures and consumption are tied closely together—in many of the states and for some of the end uses, high-consumption states are also high-expenditure states and vice versa. But in some places, high-consumption states are low-expenditure states and vice versa, indicating that households are facing particularly high or low prices. Hawaii is a clear example, which ranks at or near the bottom in consumption for cooking and water heating but at the top in expenditures for those end uses. This raises a clear need for solutions to bring down the cost of energy in states like Hawaii. In states where consumption and expenditure have a more direct relationship, saving energy will help reduce costs. Heat pumps, which are more efficient than their fossil fueled or traditional electric resistance counterparts, can go a long way in helping to save energy for space and water heating. Induction cooktops, which are three times more efficient than gas ranges and 10 percent more efficient than traditional electric ranges, can save money on that end use as well.