This data story was written by Stephen Naimoli and Katherine Shok.
While the Atlas Buildings Hub team has previously exhibited building stock information released by the U.S. Energy Information Agency’s Residential Energy Consumption Surveys (RECS), we have not included visualizations energy expenditure and consumption data also collected in the survey. In June, we delivered an update to the 2020 Residential Building Characteristics dashboard, integrating the energy expenditures and consumption data from the 2020 RECS.
This Data Story will provide a brief refresher on the residential building stock information reported in the 2020 RECS before building on that existing data set with analysis of the survey’s energy expenditure data within three primary residential building activities: space heating, cooking, and water heating. Consumption data will at times be provided for additional context. Our next Data Story will focus on the 2020 RECS’ consumption data.
The Residential Energy Consumption Survey Illuminates Household Energy Use
The 2020 RECS involved about 18,500 survey respondents nationwide, from which data was extrapolated to represent the nearly 124 million residential domestic households. Buildings Hub has previously investigated the results of this building stock’s data collection, reflected in Data Stories like “Residential U.S. Heat Pump Market Update: Trends and Developments” and “Electrifying the Midwest.”
Of these 124 million households, about a quarter (31 million) are all-electric (Figure 1). Further, 14 (17 million) percent primarily rely on heat pumps for space heating, 59 percent (72 million) primarily utilize electric-only cooktops, and 46 percent (57 million) are equipped with electric water heaters. Generally, states in the Southeast rely more on electric space heating, and they have deployed more heat pumps, electric water heaters, and electric cooktops.
Figure 1: Percentage of All-Electric Households by State, 2020
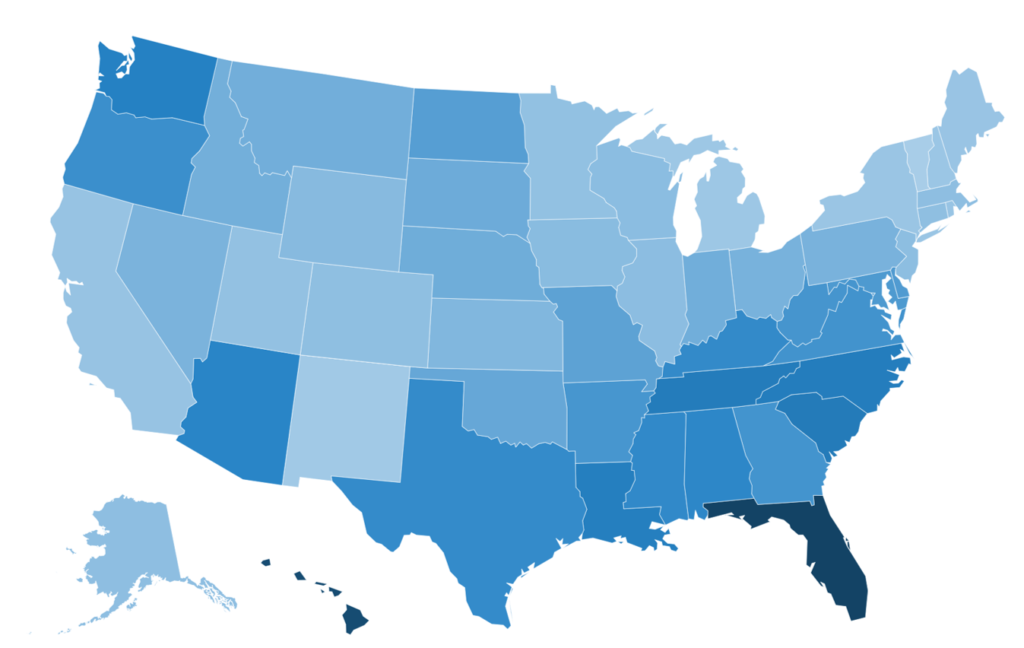
Source: Atlas Buildings Hub, 2020 Residential Building Characteristics dashboard. | Color saturation represents the percentage of all-electric households in a state. The darker the blue, the more all-electric households. Florida has the largest share at 77 percent of households, while Vermont has the smallest share at three percent.
Turning to expenditures and consumption, California, Texas, New York, Illinois, and Pennsylvania represent the five states with the largest total energy expenditure and consumption statewide, no surprise given that they represent five out of six of the largest states in the nation by population. Interestingly, Florida, with the third largest population nationwide, is eighth in total statewide energy expenditures and consumption. However, on a per household basis, Alaska, Connecticut, Rhode Island, New Hampshire, and Massachusetts have the highest annual residential costs, while Alaska, Michigan, New Jersey, Minnesota, and Illinois take the cake for consumption (Table 1).
Table 1: Annual Residential Energy Expenditures and Consumption, Top Five States per Household, 2020
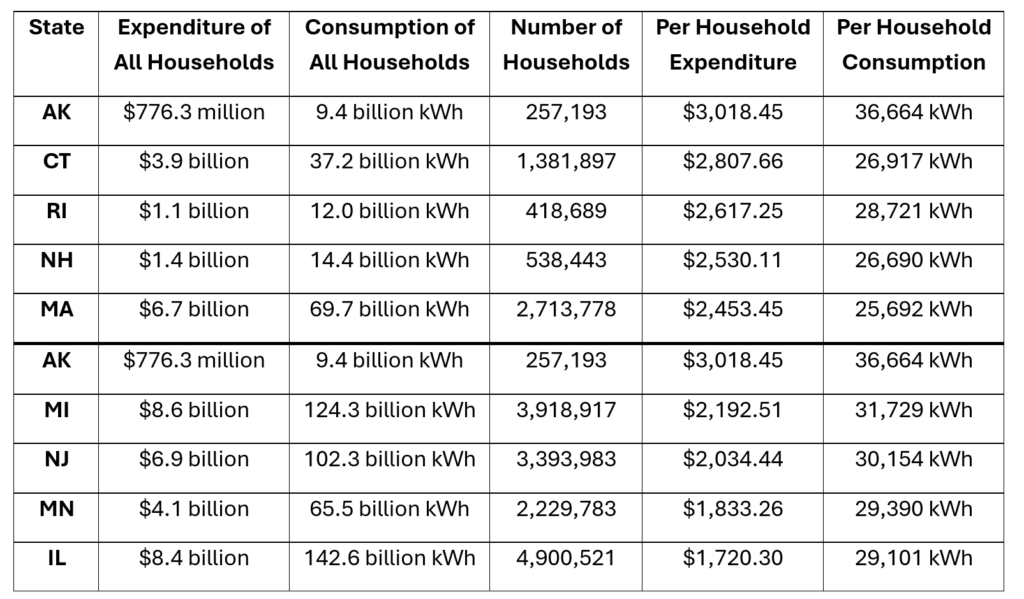
Source: Atlas Buildings Hub, 2020 Residential Building Characteristics dashboard. | State data includes the District of Columbia.
In further examining the states with the highest household expenditures, they generally appear to be in climates that experience cold, very cold, and subarctic temperatures. However, the states all have varying percentages of all-electric households, perhaps elucidating certain fuels, when used to heat a home in colder climates, generate higher energy expenditure. Indeed, households in these states rely more on delivered fossil fuels like propane and fuel oil more often than other households nationwide.
The Households Spending the Most on Space Heating
Space heating is the most expensive of the three end uses discussed in this story. On average, households paid between $5.16 and $1,221.29 for the year 2020 to heat their homes (Figure 2).
In the United States, 14 percent of households use heat pumps for space heating. Heat pumps are most prevalent in the Southeast. Most homes in the United States use electricity (which may power heat pumps but the RECS survey reveals is often older, less efficient electric resistance heating—17 million homes using heat pumps versus 25 million using electric resistance or other electric heating equipment), piped gas, fuel oil, propane, or wood.
Figure 2: Space Heating Expenditures Per Household by State, 2020
Source: Atlas Buildings Hub, 2020 Residential Building Characteristics dashboard. | Color saturation represents the total space heating expenditure in a state. The darker the blue, the higher the expenditure.
At the national level, the average household with electric heating spent about $396.40 in 2020, whereas the average household heating with gas spent $518.50 per household. Propane heating cost households an average of $1,010 and fuel oil heating cost about $1,164 per household. In all, five states with the highest space heating expenditures per household in 2020, fossil fuels dominate (Table 2). Among these five states, piped gas is the most used fuel for space heating in Alaska (57 percent of households) and Rhode Island (53 percent). Delivered fuels like fuel oil and propane are the largest sources of space heating fuel in Vermont (59 percent), New Hampshire (55 percent) and Connecticut (43 percent).
Table 2: Average Annual Energy Expenditures and Consumption for Space Heating Per Household in Top 5 and Bottom 5 Most Expensive States, 2020
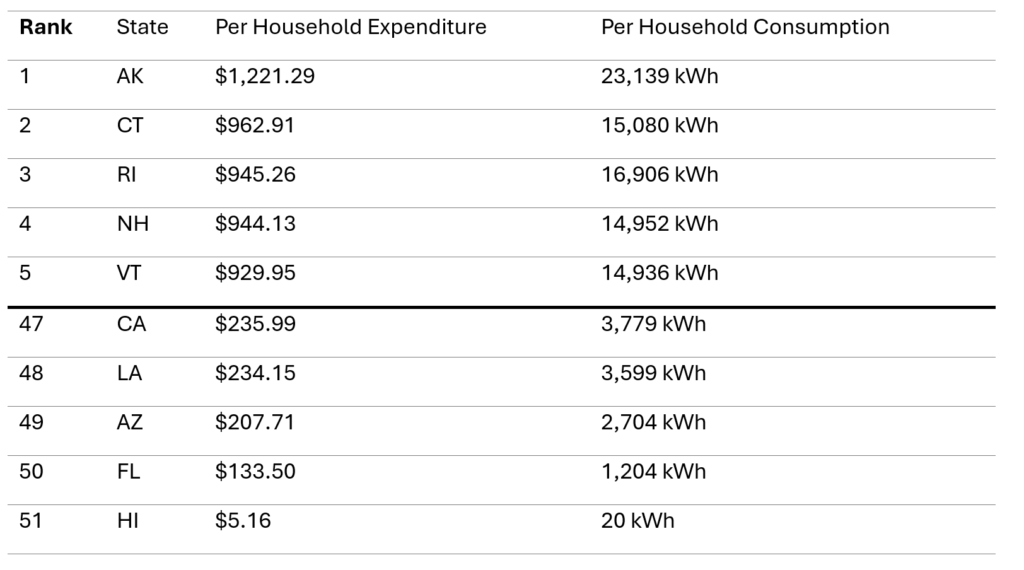
Source: Atlas Buildings Hub, 2020 Residential Building Characteristics dashboard. | State data is inclusive of the District of Columbia.
Three of the five states with the lowest expenditure per household are dominated by electricity use for space heating. Electric heating equipment is used in 66 percent of Florida households, 62 percent of Louisiana households, and 51 percent of Arizona households. Hawaii stands out as a state where 94 percent of households do not use heating equipment, but most of those who do heat with electricity. In California, gas reigns in 64 percent of households.
While fuel oil and propane tend to be much more expensive than other sources of heating, the breakdown of fuel sources across the most and least expensive states suggests that there is not one single input that determines how much households in a state pay for space heating—it is likely to be some combination of fuel prices, equipment efficiency, policy choices, and other local factors (Figure 3). Additionally, it is important to note the expenditure and consumption data does not distinguish between heat pumps and electric resistance heating, categorizing them both under electricity. Breaking out heat pumps would likely show even lower expenditures relative to electric resistance and perhaps other sources due to their high efficiency.
Figure 3: Space Heating Equipment Stock Breakdown by Fuel Among Five Highest and Five Lowest Expenditure States for Space Heating, 2020
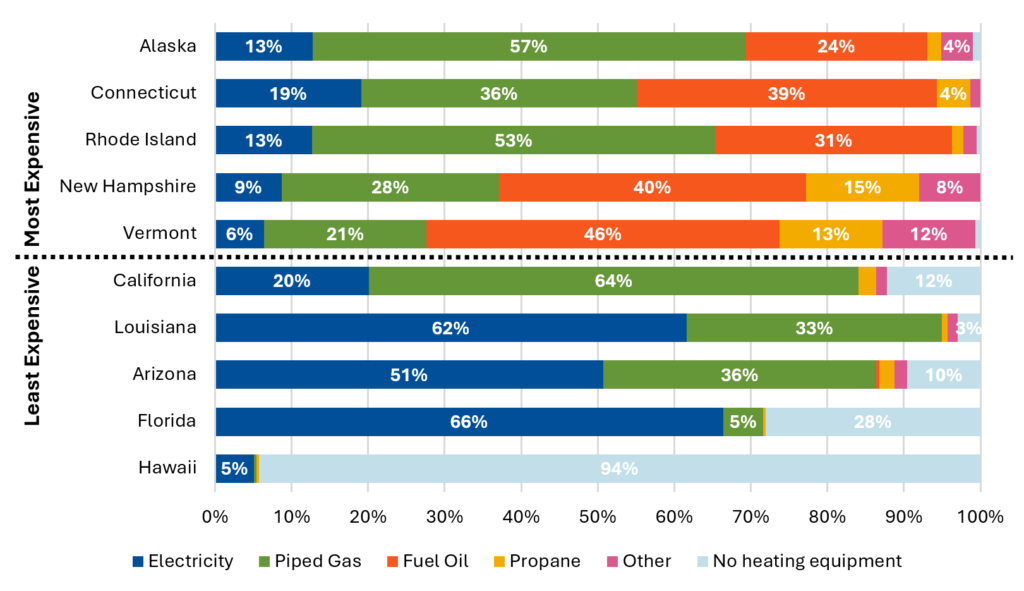
Source: Atlas Buildings Hub, 2020 Residential Building Characteristics dashboard. | State data includes the District of Columbia.
The Northeast and Alaska Pay the Most for Cooking
Cooking is the least expensive of the three end uses discussed in this story. On average, households paid between $28.18 and $67.38 for the year 2020 to cook in their homes (Figure 4).
In the United States, 59 percent of households use electric-only cooktops. Electric cooktops are most prevalent in the Southeast and the Upper Midwest. Homes that do not use electric cooktops use gas, propane, or a mix of electricity and gas.
Figure 4: Cooking Energy Expenditures Per Household by State, 2020
Source: Atlas Buildings Hub, 2020 Residential Building Characteristics dashboard. | Color saturation represents the total cooking energy expenditure in a state. The darker the blue, the higher the expenditure.
At the national level, the average household using an electric cooktop spent about $37.76 on cooking fuels for the year 2020, whereas the average household with a gas cooktop spent $34.15 per household. Those using propane stoves cost households an average of $57 and using a mix of electricity and gas cost about $45 per household. In four of the five states with the highest per household cooking expenditures in 2020, electricity dominates (Table 3). Electric stoves are used in 75 percent of Hawaiian households, 67 percent of Maine households, and 58 percent of Alaskan and Rhode Island households, respectively.
Table 3: Average Energy Expenditures and Consumption for Cooking Per Household, 2020
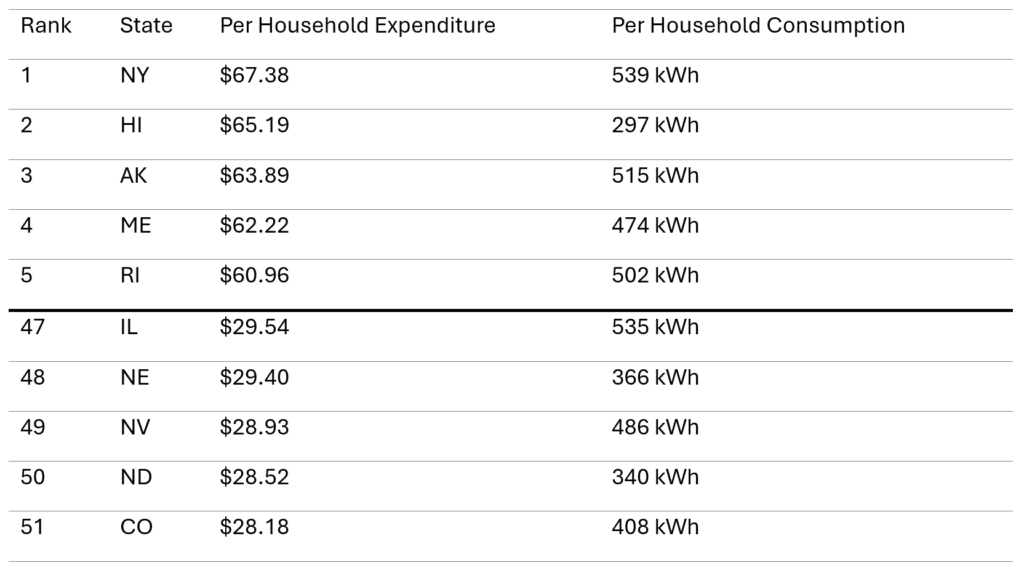
Source: Atlas Buildings Hub, 2020 Residential Building Characteristics dashboard. | State Data includes the District of Columbia.
Among the five states with the lowest expenditure per household, three are also dominated by electricity (Figure 5). North Dakota, Nebraska, and Colorado use electric cooking in 81 percent, 71 percent, and 61 percent, respectively. Electric cooking largely dominates in most of the top five and bottom five states for cooking energy expenditures. This breakdown suggests that there is not one single input that determines how much households in a state pay for cooking—it is likely to be some combination of fuel prices, equipment efficiency, policy choices, and other local factors.
Figure 5: Cooktop Stock Breakdown by Fuel Among Five Highest and Five Lowest Expenditure States for Cooking, 2020
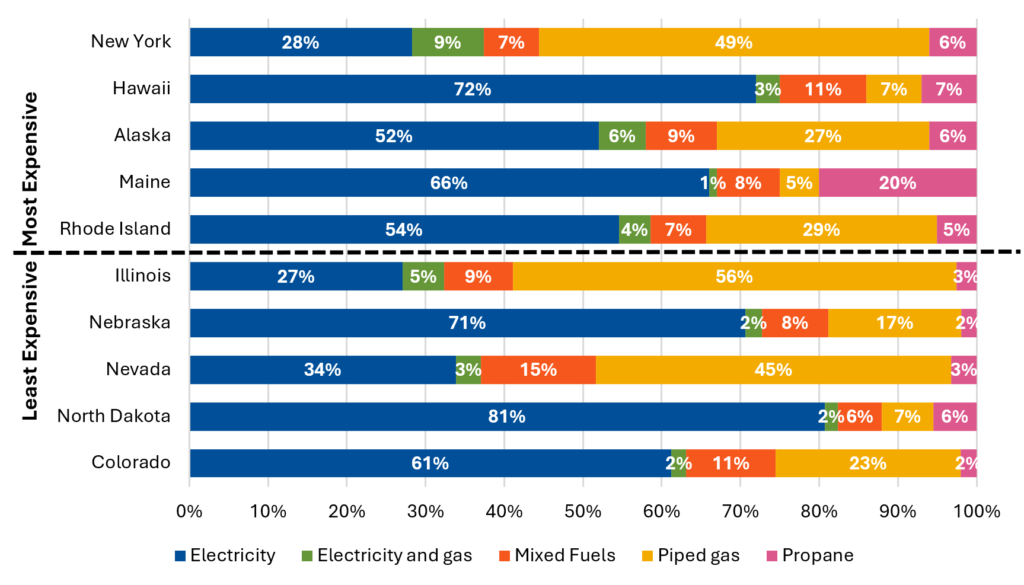
Source: Atlas Buildings Hub, 2020 Residential Building Characteristics dashboard. | State Data includes the District of Columbia.
Water Heating Costs Almost as Much as Space Heating
Water heating is more expensive than cooking but less expensive than space heating in the United States. On average, households paid between $173.03 and $482.32 in 2020 to heat water in their homes (Figure 6).
In the United States, 46 percent of households use electricity to heat their water. Electric water heaters are most prevalent in the Southeast. Most homes that do not use electric water heaters use gas, propane, or fuel oil, but a few homes use solar, wood, or other sources.
Figure 6: Water Heating Expenditures Per Household by State, 2020
Source: Atlas Buildings Hub, 2020 Residential Building Characteristics dashboard. | Color saturation represents the total water heating expenditure in a state. The darker the blue, the higher the expenditure.
At the national level, the average household using electric water heaters spent $341 in 2020, while the average household using gas water heaters spent $224. Those using propane spent $392 and households using oil for water heating spent $367. In four of the five states with the highest per household water heating expenditures in 2020, fossil fuels dominate (Table 4). Gas, oil, or propane water heaters are used in 74 percent of Alaskan households, 72 percent of New York households, 64 percent of Vermont households, and 61 percent of New Hampshire households.
Table 4: Average Energy Expenditures and Consumption for Water Heating Per Household in Top 5 and Bottom 5 Most Expensive States, 2020
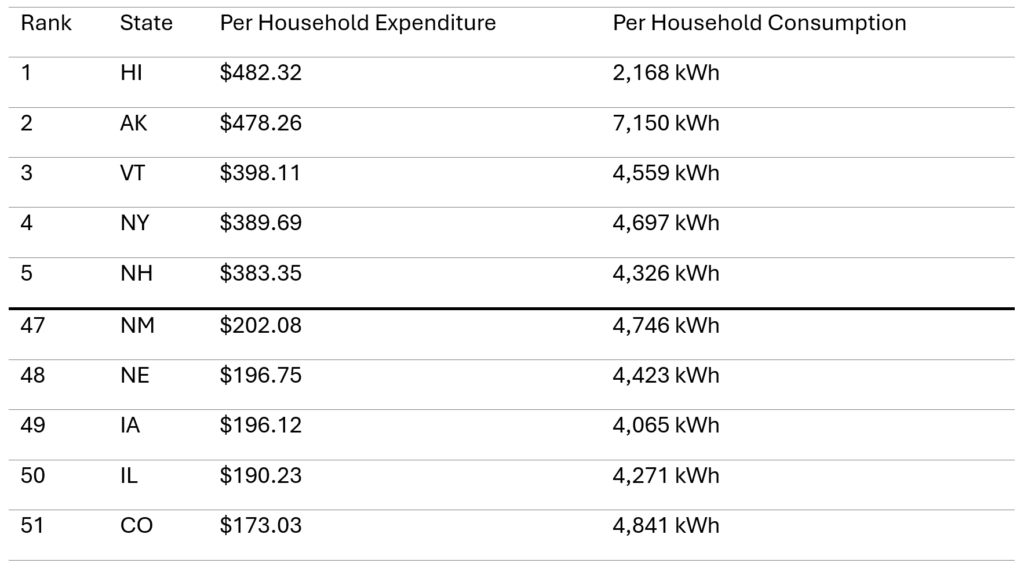
Source: Atlas Buildings Hub, 2020 Residential Building Characteristics dashboard. | State Data includes the District of Columbia.
There is much less variation among the five states that pay the least for water heating. In all five, gas water heaters are much more prevalent than any other kind. The fact that there is no clear association between fuel source and water heating expenditures suggests that, much like with water heating, how much a household pays for water heating is driven by a combination of factors, including fuel prices, climate, equipment efficiency, policy choices, and other local concerns (Figure 7). Much like with heat pumps for space heating, the data does not distinguish between traditional electric water heaters and the much more efficient heat pump water heaters. Heat pump water heaters are much more efficient than traditional electric water heaters, so households with heat pump water heaters pay much less.
Figure 7: Water Heating Stock Breakdown by Fuel Among Five Highest and Five Lowest Expenditure States for Water Heating, 2020
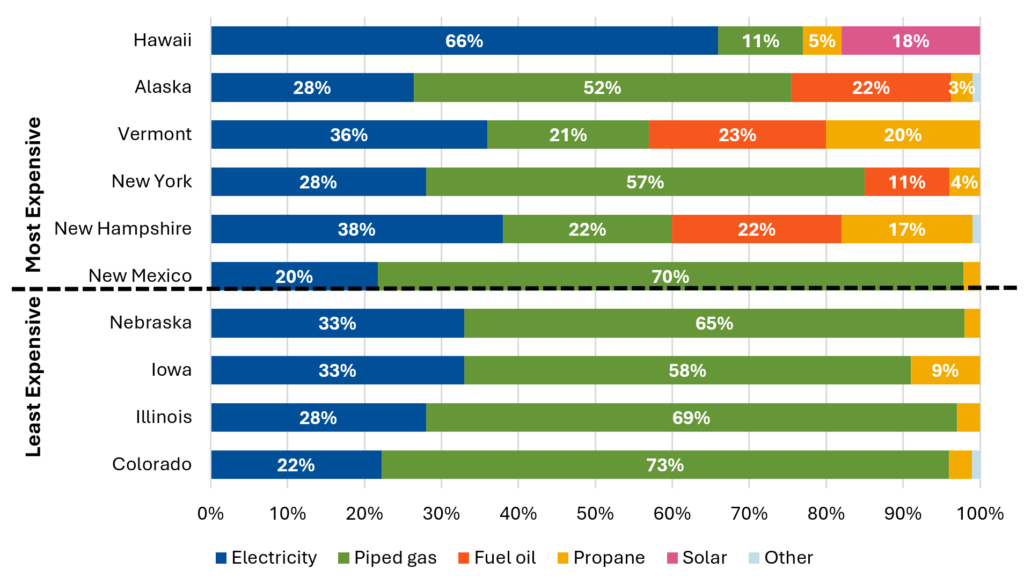
Source: Atlas Buildings Hub, 2020 Residential Building Characteristics dashboard. | State Data includes the District of Columbia.
Home Energy Costs Vary Dramatically Across the United States
States differ greatly in how they heat their homes, cook their food, and heat their water. In warm climates, many do not need any space heating, but water heating is still necessary. In cold climates, the need for space heating is high. Alaska, for example, is one of the most expensive states for space and water heating as well as cooking. Hawaii, on the other hand, spends the least on space heating but spends the most on water heating.
There is no simple explanation for why certain states pay more for space heating, cooking, and water heating than others. Each end use requires an in-depth look. Climate, fuel prices, and policy decisions appear to be a few of the likely regional factors that affect prices, but technology costs and equipment efficiencies seem to play a role as well.
Separately, the lack of delineation between heat pumps and electric resistance heating for space and water heating means that the data obscure the difference in the necessary expenditures for these technologies. Identifying this would help illuminate the extent to which heat pumps may be able to save households money.
In the next data story, Atlas Buildings Hub staff will explore the consumption data from RECS and how it relates to how much the typical household pays for energy.