This is the first in a two-part Data Story series on how we use and pay for the energy in our homes.
Over the last few years, rising energy bills have been a hot topic. From New England to the South, customers have paid a lot more as inflation has ebbed and flowed and as the weather has become more extreme. But what determines what we pay for energy in our homes? And how have those inputs changed over time? The first piece of the puzzle is what we pay for the fuels we use in our homes.
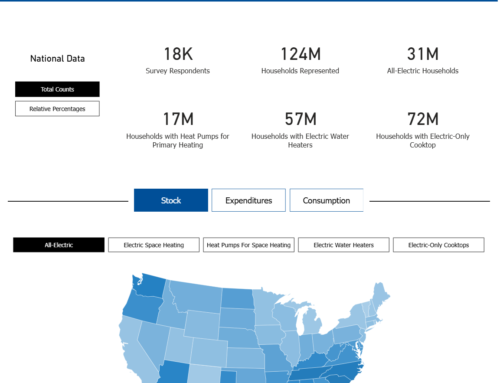
On Buildings Hub, we collect data from the U.S. Energy Information Administration to track the monthly prices of these fuels. We use this data to understand how those prices have changed over time and how they vary from place to place. In our next data story, we will cover how these prices help determine what we ultimately pay our utilities to heat and cool our homes.
Here, we discuss regional trends in real energy prices (adjusted for inflation) across two main fuels: electricity and piped gas. We use electricity to power a great many things in our homes: things like lights, televisions, computers, air conditioning, and, in almost 43 million homes, space heating (as well as water heating in 57 million homes). We use piped gas primarily for heating—63 million homes use gas for space heating and 59 million homes heat their water with gas. In regions with significant proportions of use in other fuels for heating—namely delivered fuel oil in the Northeast and propane in the Midwest—this comparative analysis is extended. But first, we must establish what determines the prices of these fuels.
What Determines Pricing?
Across fuels, weather is a major factor in prices — usually indirectly in how it determines demand for heating and cooling and therefore the fuels needed to power those, although in the case of electricity, weather impacts the availability of supply of both weather-dependent power sources (such as for solar, wind, or hydropower) and fuels (such as if extreme cold freezes coal piles or gas pipes and makes them inaccessible). In the case of both electricity and piped gas, state-level regulators decide whether retail rates are “just and reasonable,” so prices can be affected by regulatory commissions and the often drawn-out rate-setting process. With fuels like heating oil and propane that are not as widely used across the country (only about four percent of households use heating oil or propane for space heating, respectively), variation in the number of producers in an area can drive the market price up or down.
It is important to note that the price of electricity or piped gas does not by itself determine the price of heating or cooling. What customers ultimately pay is more complicated and depends on consumption (and therefore both behavioral patterns of consumers as well as the efficiency of the equipment) as well as fixed charges established by the utilities and their regulators. The next data story will dive into consumption and expenditures data from the EIA as well as new developments in electric heating that are not captured in the data.
Regional Trends
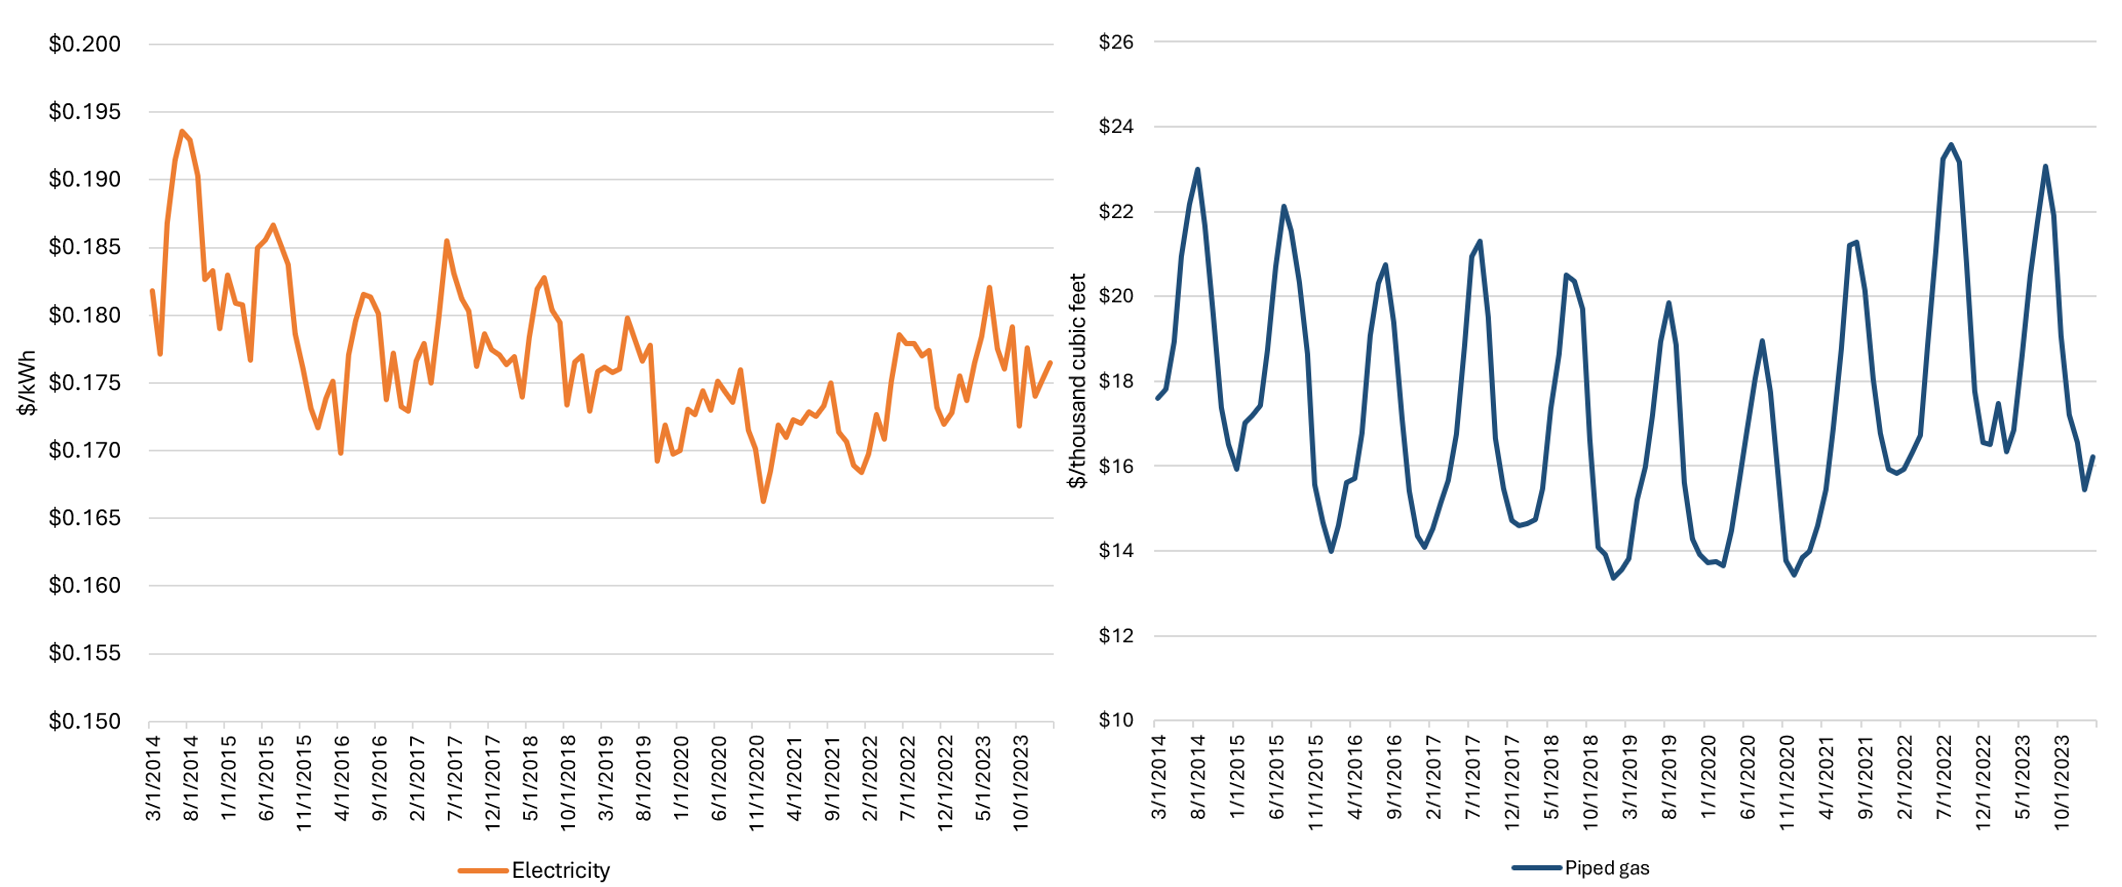
On average, electricity cost about $0.18 per kilowatt-hour (kWh) and piped gas cost about $18 per thousand cubic feet over the last ten years in the United States. At the regional level, however, electricity was more expensive than average in the Northeast, as expensive in the West, and cheaper than average in the Midwest and South. Piped gas was more expensive than average in the South and Northeast and less expensive in the West and Midwest. In this section, we use U.S. Energy Information Administration data collected on Buildings Hub to examine price trends within these regions.
Northeast
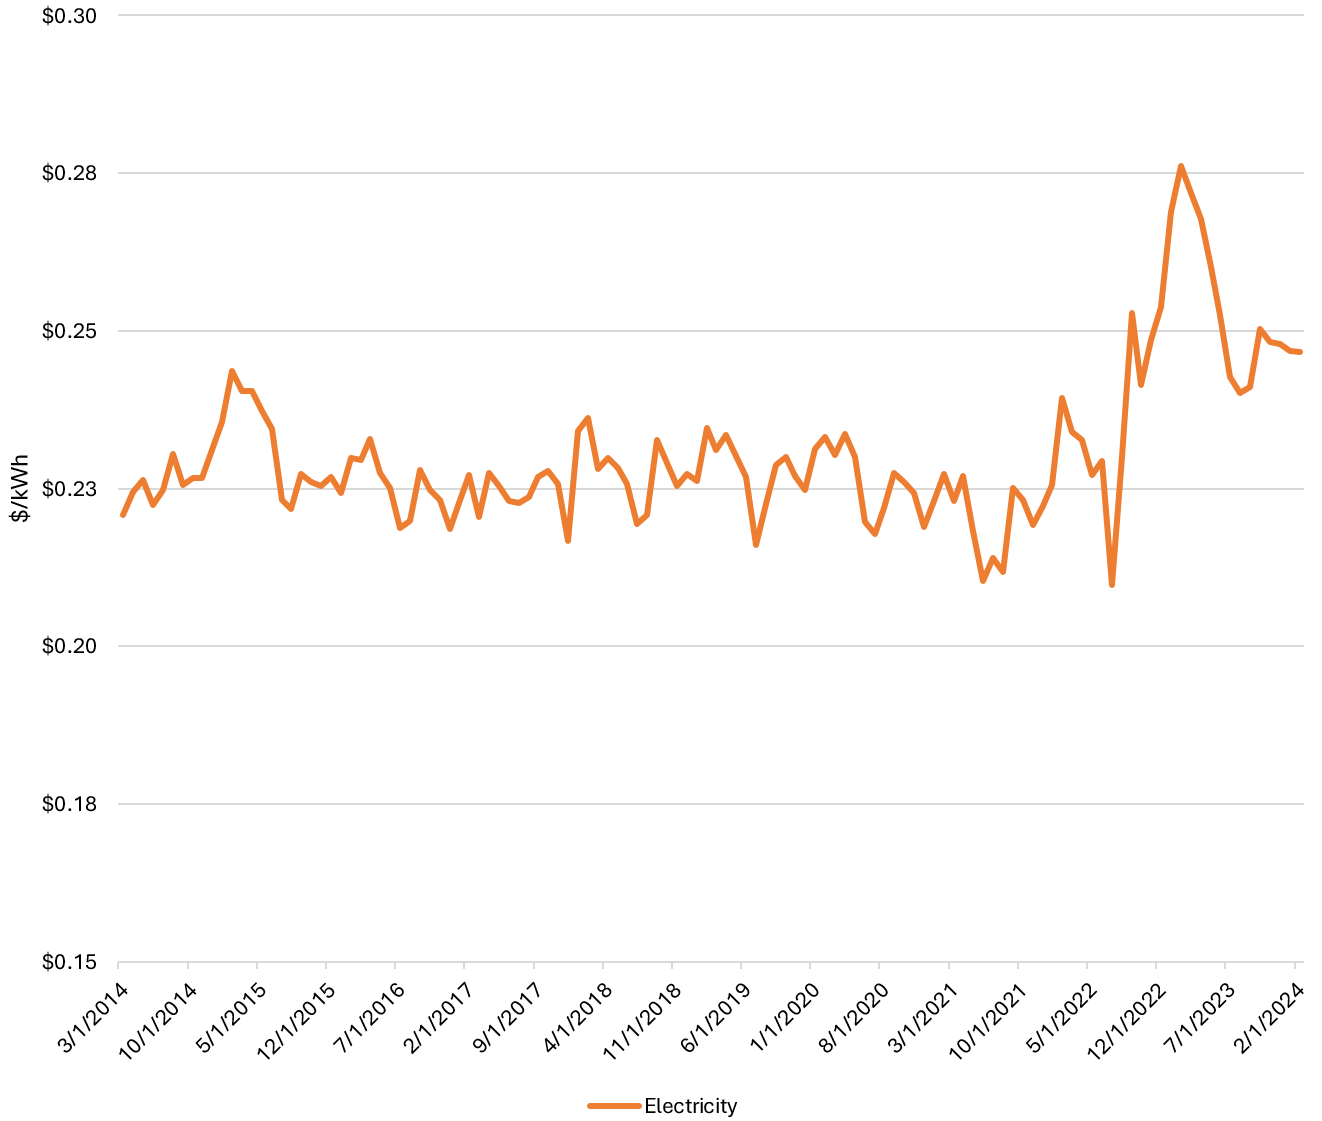
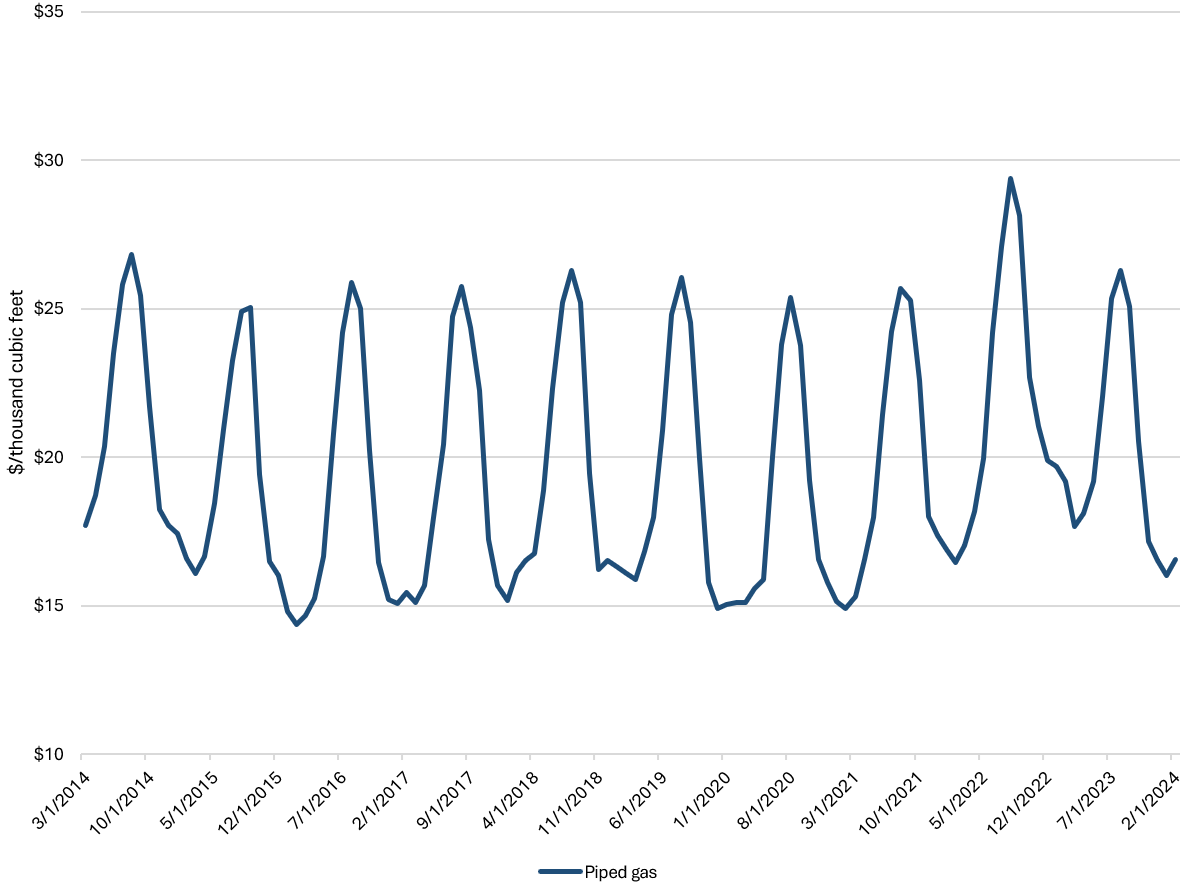
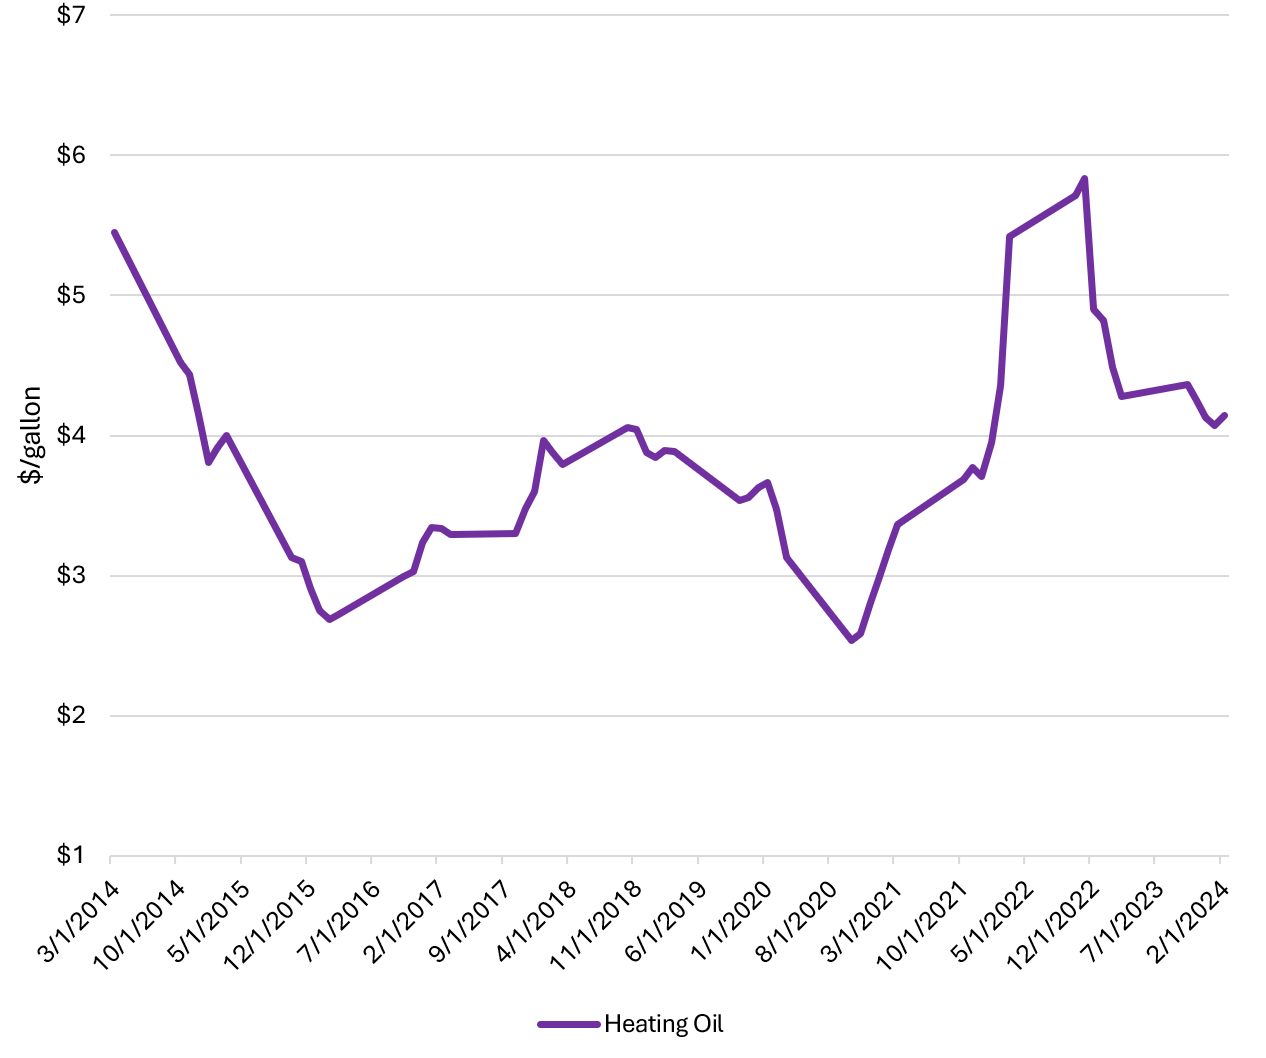
Over the last ten years, electricity prices remained relatively steady around $0.23 per kilowatt-hour (kWh) until 2022 (Figure 1). Then, a relatively small but noticeable increase began, peaking at $0.28 (a 22 percent above the historical average) and landing around $0.25 (nine percent above the historical average). Residential piped gas prices have reliably swung between around $15 per thousand cubic feet every January to around $25 every August (a 67 percent change). Heating oil and propane, which are in much higher use in the Northeast than other regions (with fuel oil heating about 19 percent of homes and propane about 5 percent), saw wild swings over the last ten years. Heating oil prices reached a low of $2.54 per gallon in October 2021 and a high of $5.84 in November 2022 (a 130 percent increase), while propane was at its most expensive at $5.35 per gallon in March 2014 and prices have generally stabilized since 2015 between three and four dollars per gallon.
Figure 1: Northeastern Residential Energy Prices, March 2014 – February 2024
Midwest
Over the last ten years, electricity prices have varied by about $0.02 per kWh each year, peaking in late summer around $0.17 per kWh and bottoming out around $0.14 in each January (Figure 2)—a 21 percent change. Residential piped gas prices typically have varied from about $10 per thousand cubic feet each January/February to around $23 every July (a 130 percent change). Heating oil prices have generally reflected the trends seen in the Northeast: reaching a low of $2.16 per gallon in February 2016 and a high of $5.11 in November 2022 (a 137 percent increase). Propane prices peaked at $3.38 per gallon in March 2014 and have more recently varied from $1.68 to $2.74.
Figure 2: Midwestern Residential Energy Prices, March 2014 – February 2024
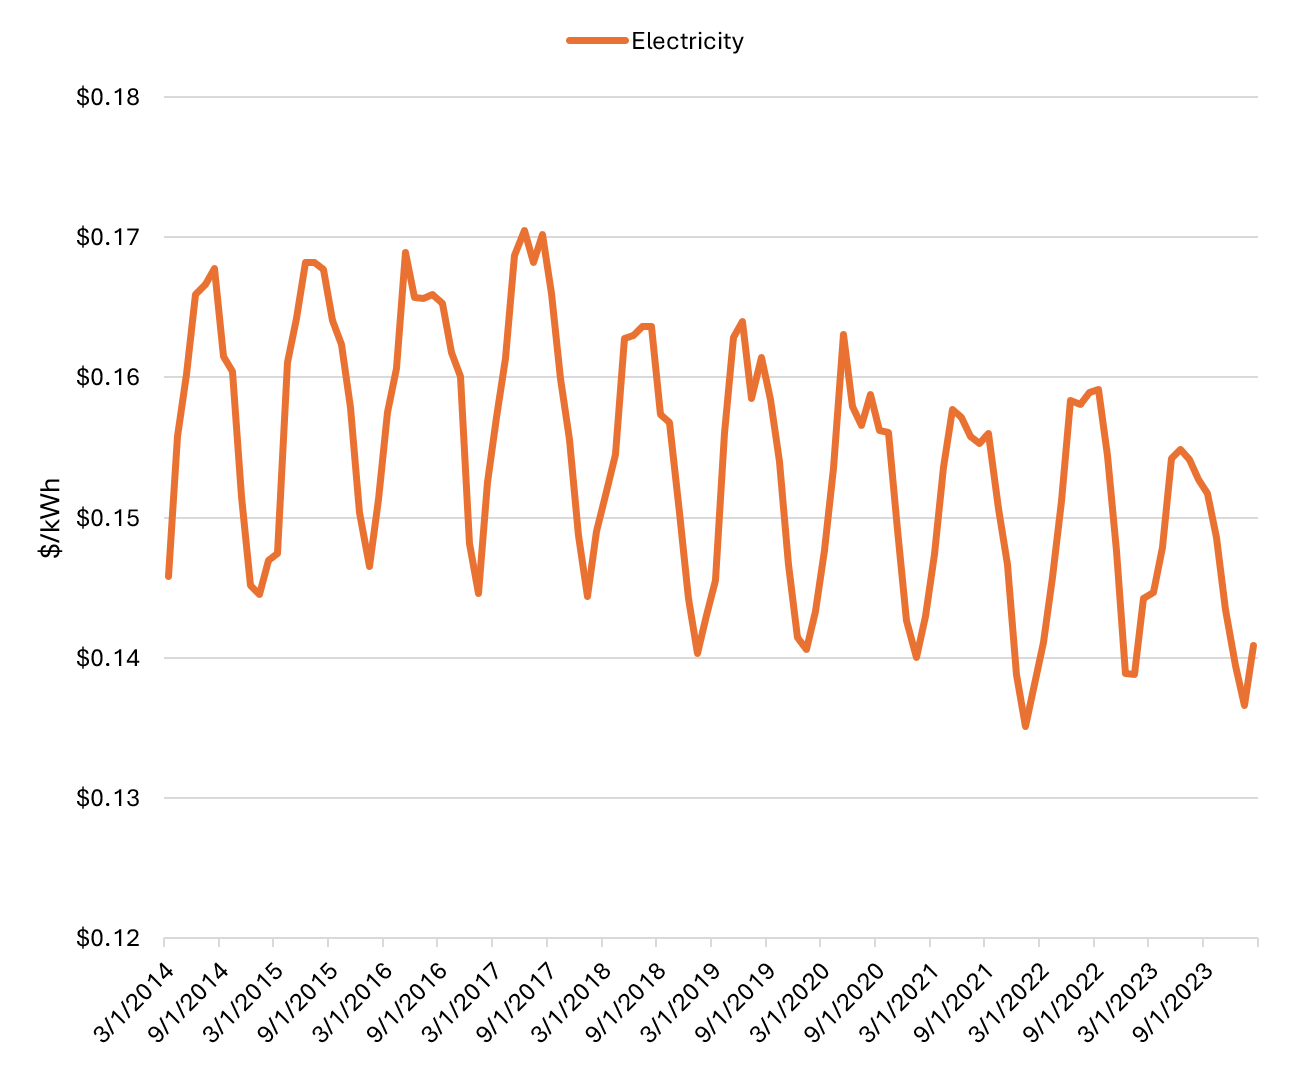
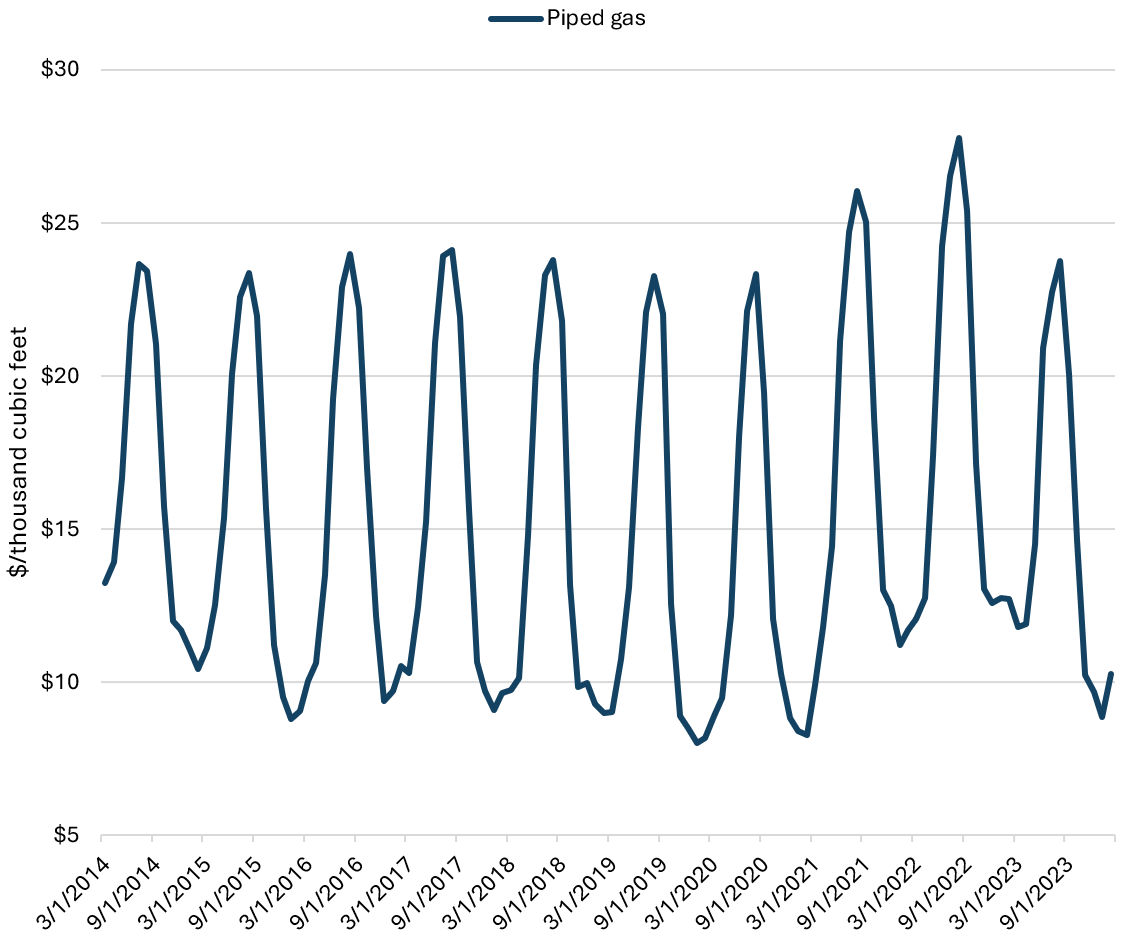
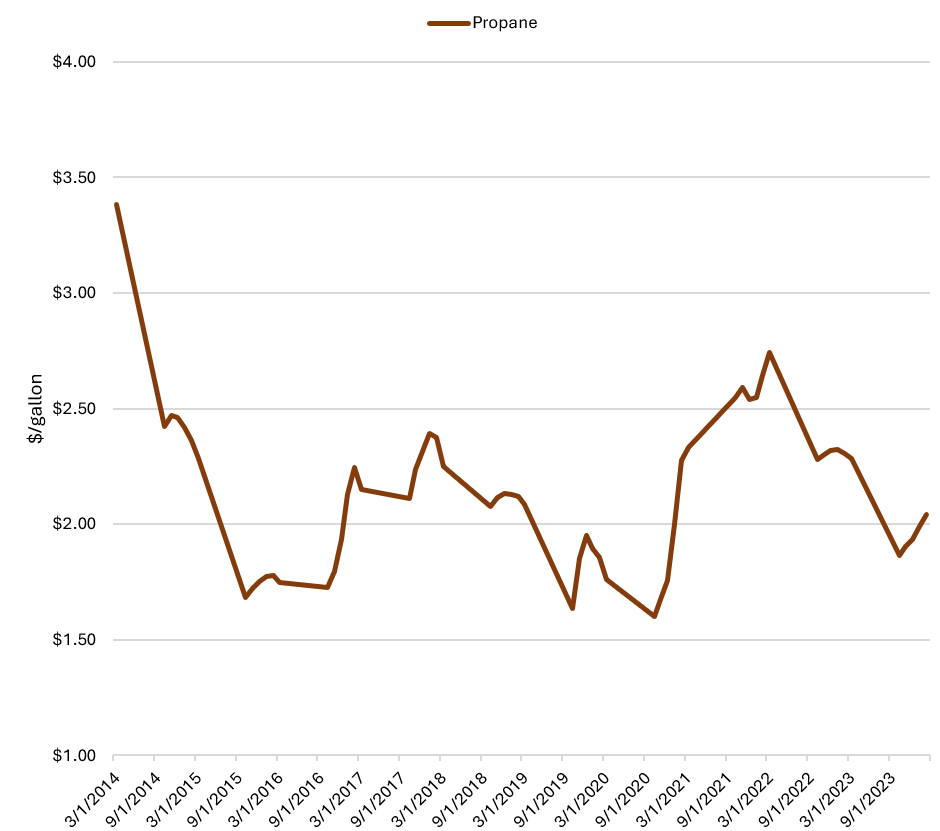
Source: Atlas Buildings Hub, Market Factors dashboard | Note propane prices are reported from September to March, so full-year trends are not comparable to those in electricity or gas prices
South
Over the last ten years, electricity prices have varied by $0.01 to $0.02 per kWh each year, with two peaks—one around $0.15 per kWh in late spring and one between $0.14 and $0.15 per kWh in the fall (Figure 3). Prices typically bottom out between $0.13 and $0.14 each January (an 8 to 15 percent change throughout the year). Residential piped gas prices typically have varied from about $12 or $13 per thousand cubic feet each February to around $28 every August (a 120 percent increase). Heating oil is used in ten states in the South plus Washington, D.C., while propane is used in 16 (six states use both). Heating oil prices hit low points of $2.86 per gallon in February 2016 and $2.62 per gallon in October 2020. The highest price in the last ten years was $5.25 per gallon in November 2022 (about a 100 percent increase from the October 2020 low). Propane prices peaked at $4.78 per gallon in March 2014 and have more recently varied from $2.74 to $3.76.
Figure 3: Southern Residential Energy Prices, March 2014 – February 2024
West
Over the last ten years, electricity prices have varied by about $0.01 to $0.02 per kWh each year, peaking between $0.17 and $0.19 per kWh in June and July (Figure 4). Prices typically bottomed out between $0.165 and $0.175 per kWh (a three to 15 percent change), although this occurs with less regularity than in other regions. Residential piped gas prices typically have varied from about $14 to $16 per thousand cubic feet each January to around $21 to $24 every August (a 31 to 71 percent increase). Heating oil is not used in the West, but propane is used in Colorado, Idaho, Montana, and Utah. Propane prices saw their lowest price in the last ten years March 2020 at $1.86 per gallon and prices were highest in February 2024 at $3.52 per gallon (an 89 percent increase).
Figure 4: Western Residential Energy Prices, March 2014 – February 2024
Regional Differences
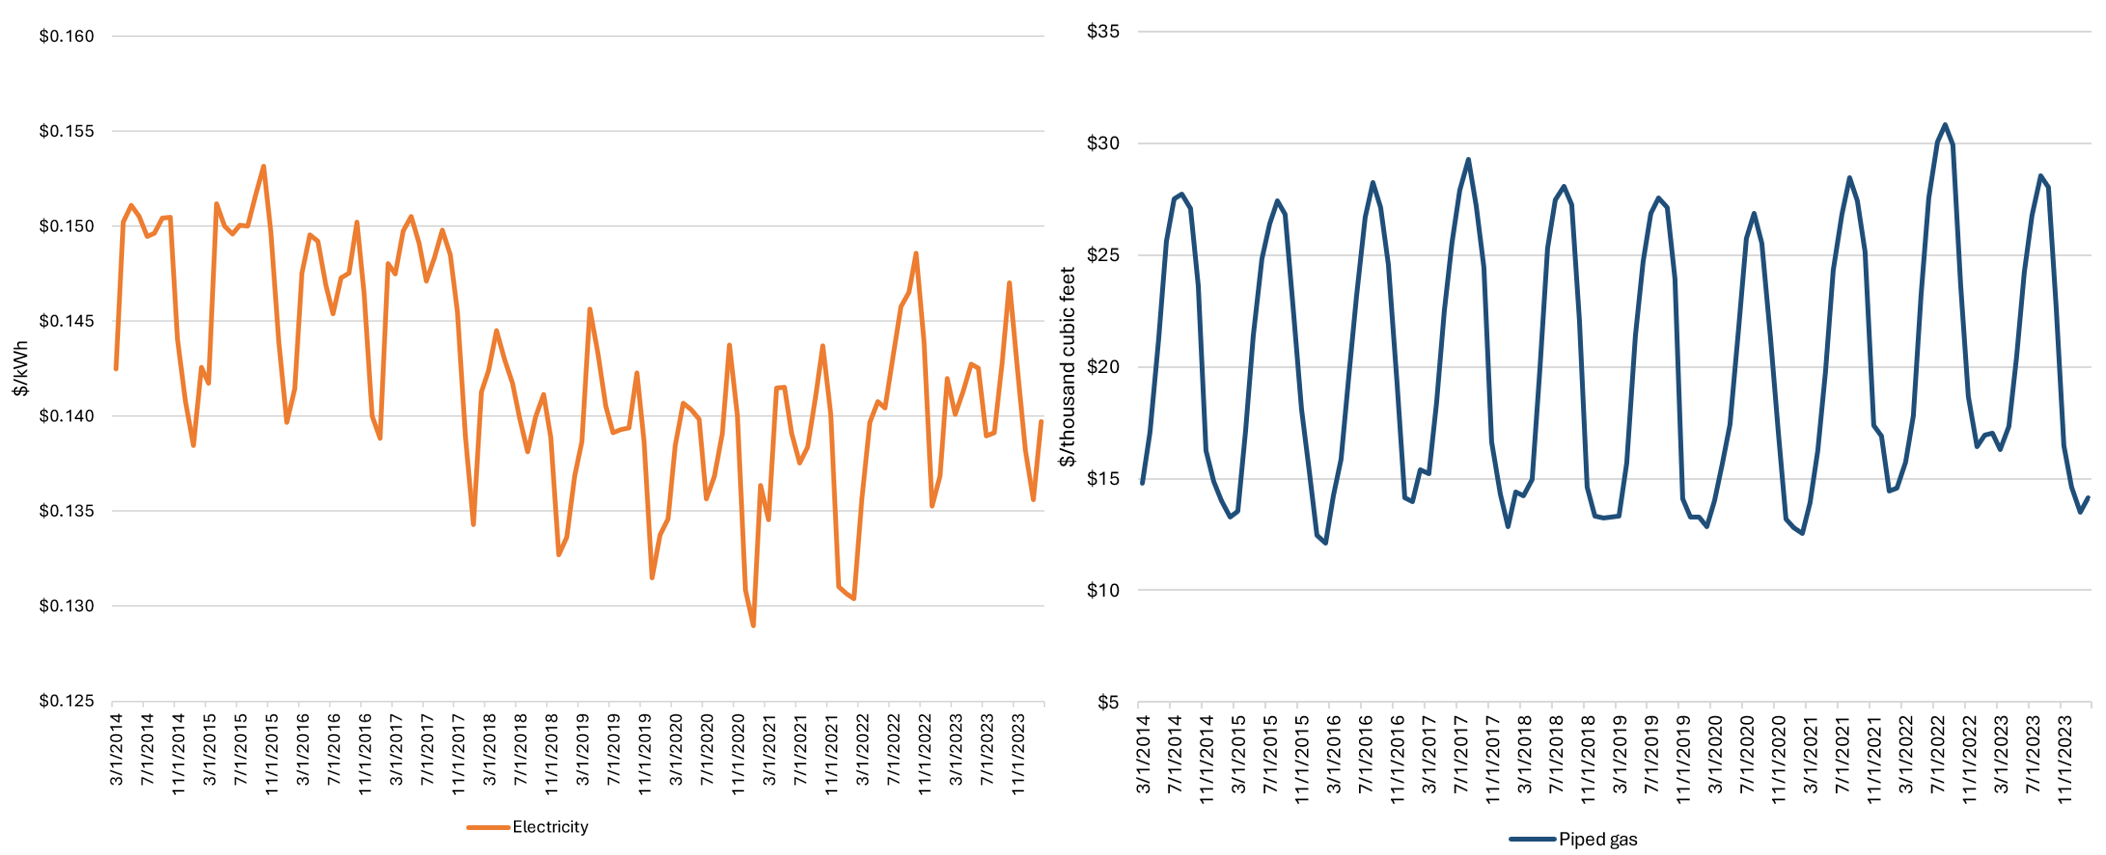
Households pay significantly different prices for electricity across regions. The Northeast has shown the most variation in electricity prices, at fluctuations up to $0.10 per kWh (Figure 5). This is largely driven by a recent spike in electricity prices in the Northeast, something that has not been observed in other regions. The South has shown the least variation in electricity prices, varying only $0.02 per kWh. The Northeast also has the highest average price at $0.23 per kWh, while the South has had the cheapest electricity, averaging $0.14 per kWh over the past decade.
Figure 5: Regional Price Comparison for Electricity, March 2014-February 2024
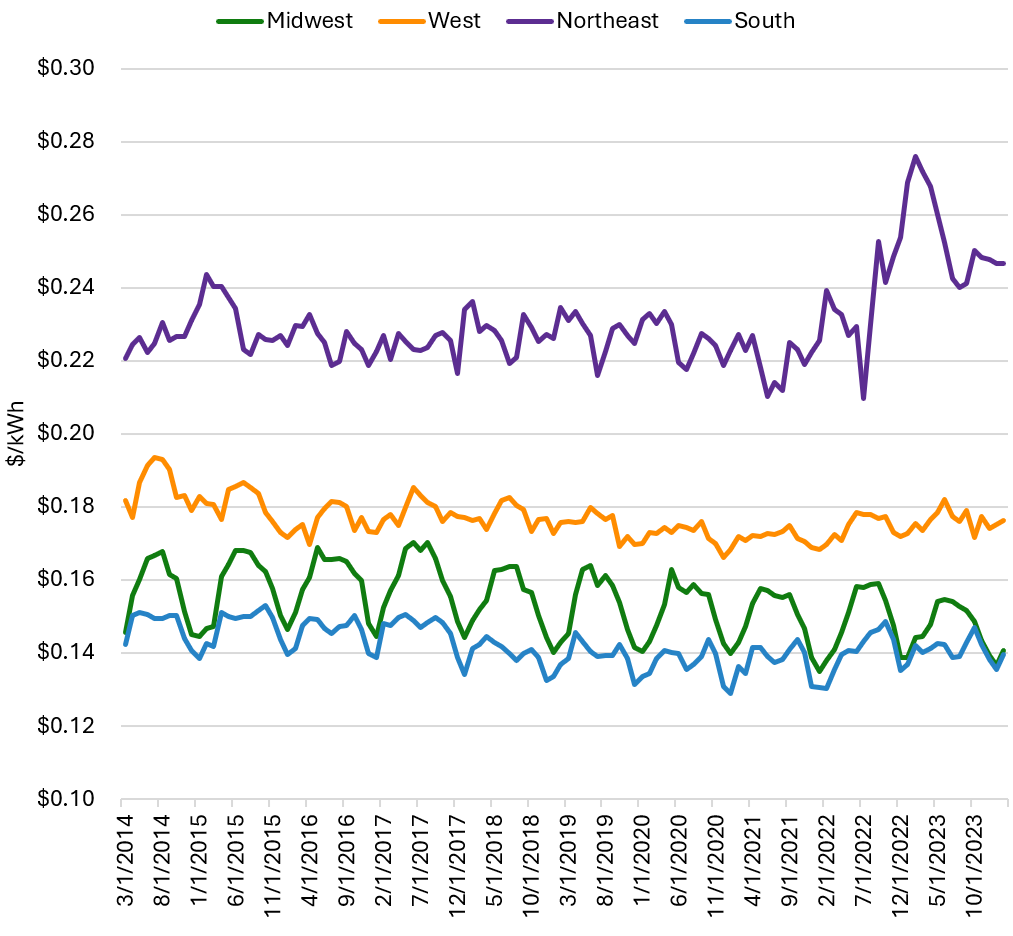
Source: Atlas Buildings Hub, Market Factors dashboard
Over the last ten years, the spread of piped gas prices across regions has been smaller than the spread of electricity prices. Within regions, the West has shown the least variation in piped gas prices, with a spread of $10.21 per thousand cubic feet (Figure 6). The Midwest has had the greatest, varying by $19.75. On average, the Midwest has had the cheapest gas at $15.29 per thousand cubic feet. Unlike with electricity, the South has had the most expensive gas on average at $20.17 per thousand cubic feet.
Figure 6: Regional Price Comparison for Piped Gas, March 2014-February 2024
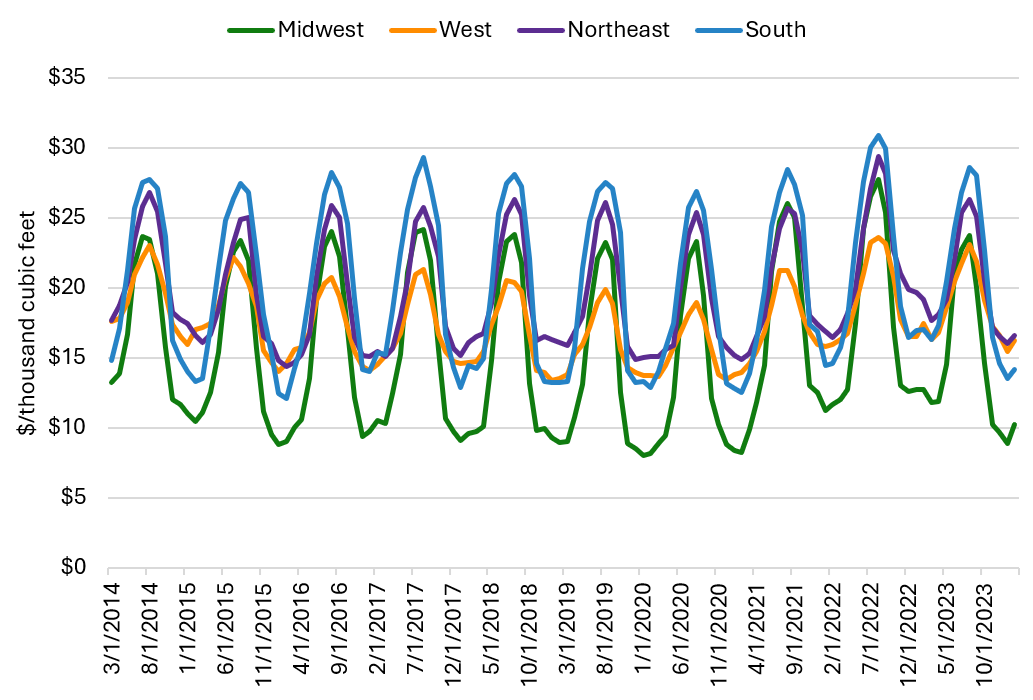
Source: Atlas Buildings Hub, Market Factors dashboard
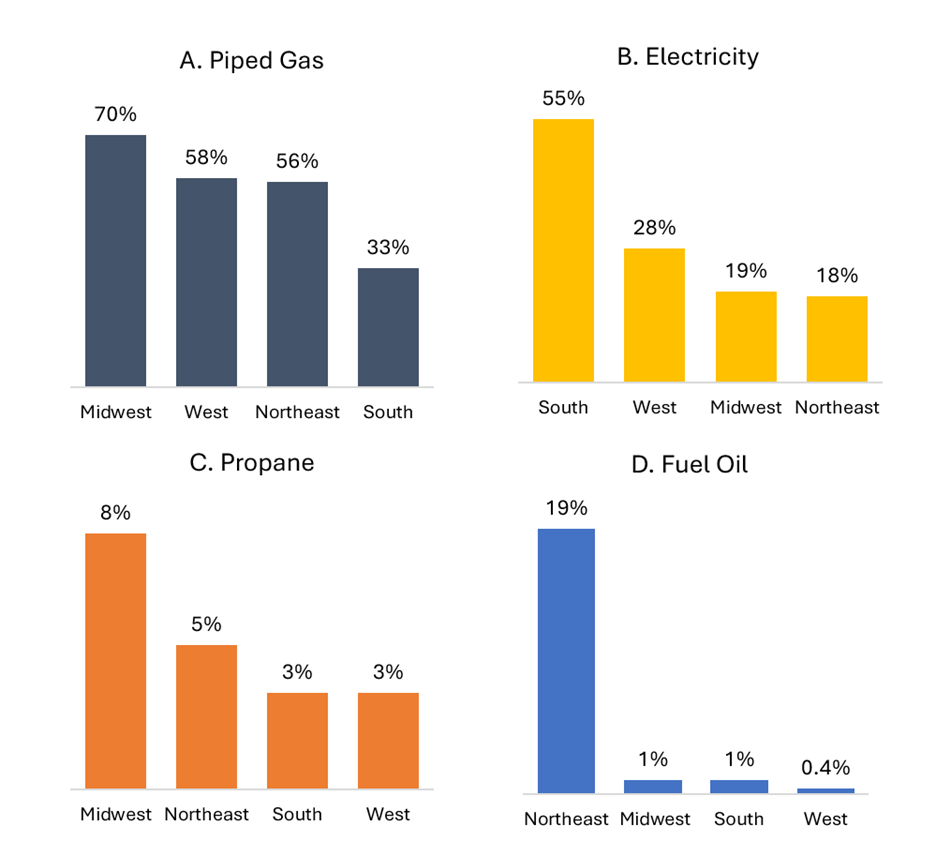
The variation in prices across regions can be partially explained by the reliance on different fuels in each region. The Midwest is particularly reliant on piped gas, as evidenced by the fact that 70 percent of households use it as their primary heating fuel (Figure 7). Piped gas has seen the most variation in price among the four regions but has also been the cheapest on average in the Midwest compared to other regions. The South is the largest consumer of electricity for space heating, with 55 percent of households primarily using it (although this is mostly older electric resistance heating, as opposed to new heat pumps). Accordingly, the South has had the cheapest electricity and the least variation in its price. The Midwest is also the most reliant on propane for heating, and it was cheaper on average over the last ten years than in other regions. The Northeast breaks this trend, as it is by far the region most reliant on heating oil (thanks to older homes and a history of regulations that discouraged switching to other heating sources) but is one of the most expensive regions for the fuel at $3.78 on average compared to $3.63 on average nationwide.
Figure 7: Regional Fuel Dependency by Primary Space Heating Fuel, 2020
Conclusion
The United States is a very large, very diverse country with varying needs for heating and cooling. At the national level, the average price of electricity has stayed virtually the same over the last ten years. However, regional trends reveal very different stories, ranging from an average of $0.14 per kWh in the South (19 percent below the national average) to $0.23 in the Northeast (31 percent above the national average). National average prices for piped gas more accurately reflect the volatility of gas prices, but average prices from region to region can still be as much as 11 percent higher than the national average or as little as 16 percent lower. Understanding what heating fuels cost and how they vary helps illuminate their role in rising energy bills.
In the next quarterly data story, we will use residential energy consumption and expenditure data alongside key research to take a look at how much energy residents are using to heat their homes, how much they are paying for it, and how that differs from technology to technology (featuring data that will be coming to the Residential Building Characteristics dashboard soon). Further, we will draw on additional data to demonstrate how shifting to highly efficient electric heat pumps will reduce energy bills across most of the United States.