Per the U.S. EPA, roughly 13 percent of direct national greenhouse gas emissions are generated by the residential and commercial buildings sector. According to the U.S. Energy Information Administration (EIA), 42 percent of household energy consumption can be attributed to space heating, the direct onsite combustion of gas, propane, and fuel oil to heat homes. As such, to cut building emissions, policy advocates and legislators have championed the heat pump as the principal tool of building decarbonization.
But what does the residential heat pump and home heating market look like in the United States? What states are leading or lagging on heat pump adoption and electric space heating? How much progress has been made over time? With this article, and in our larger data story, we dive into these questions.
The data points and analysis included in this piece draw upon the Buildings Hub 2020 Residential Building Characteristics dashboard, which surfaces data from the latest EIA Residential Energy Consumption Survey.
Home Heating Landscape
According to Buildings Hub, in 2020, only one in three U.S. households reported electricity as their primary space heating fuel, while over half relied on piped gas. The South is by far the most electrified region, with 55 percent of households using electricity for primary space heating, followed by the West (28 percent), the Midwest (19 percent), and lastly, the Northeast (18 percent).
Figure 1: Regional Fuel Dependency by Primary Space Heating Fuel (2020)
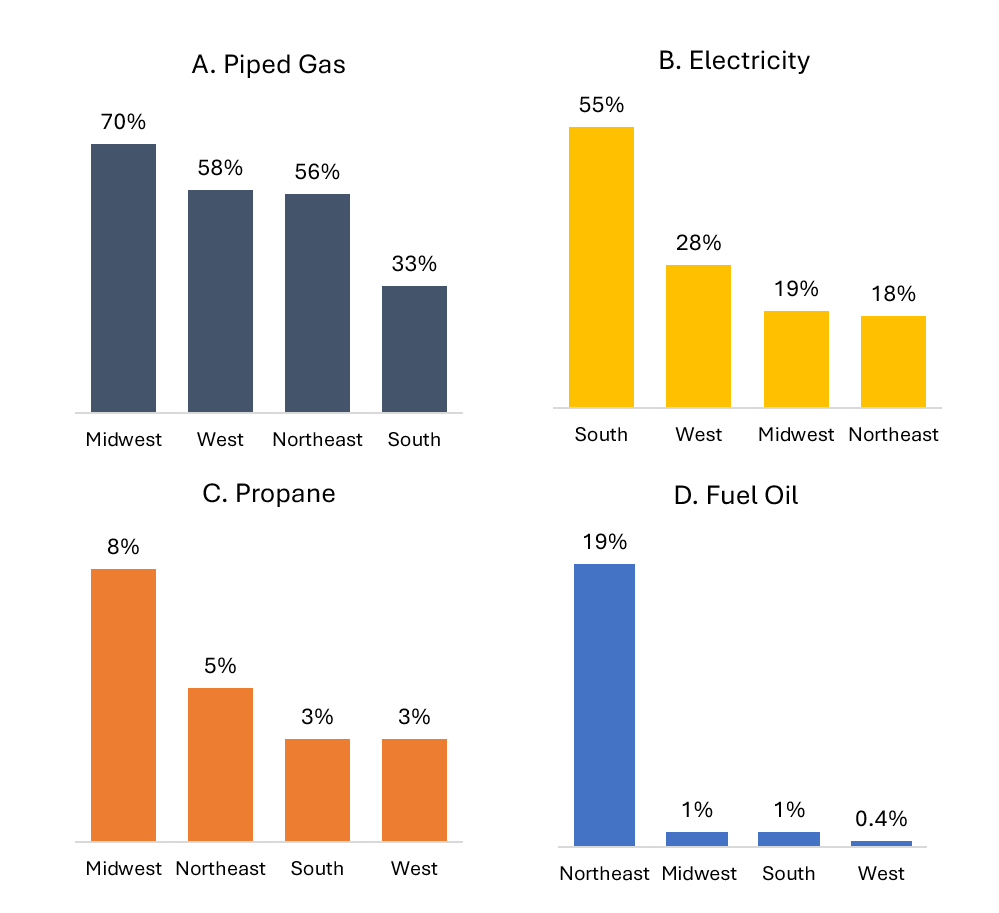
Source: Atlas Buildings Hub
Across all U.S. census regions, save the South, the majority of households depend on piped gas for primary space heating. The Midwest is the most gas-reliant region, with 70 percent of households burning methane to stay warm. In fact, Illinois and Michigan are two of the most gas-dependent states in the country, with 78 percent and 77 percent of households using piped gas, respectively. It is also the region most dependent on propane for space heating, with a household dependency twice the national average at 8 percent. An important outlier, the Northeast is by far the region most reliant on fuel oil, with nearly 20 percent of households burning petroleum for primary space heating, five times the national average (Figure 1).
Residential Heat Pump Adoption
In terms of heat pump adoption over time, between 2005 and 2020 the share of U.S. households with primary heat pumps rose from 8 to 14 percent (Figure 2). That equates to about 17.2 million U.S. households with primary heat pumps in 2020, with 80 percent of those households located in the South (Figure 3).
Figure 2: Percent of U.S. Households with Primary Heat Pumps (2005-2020)
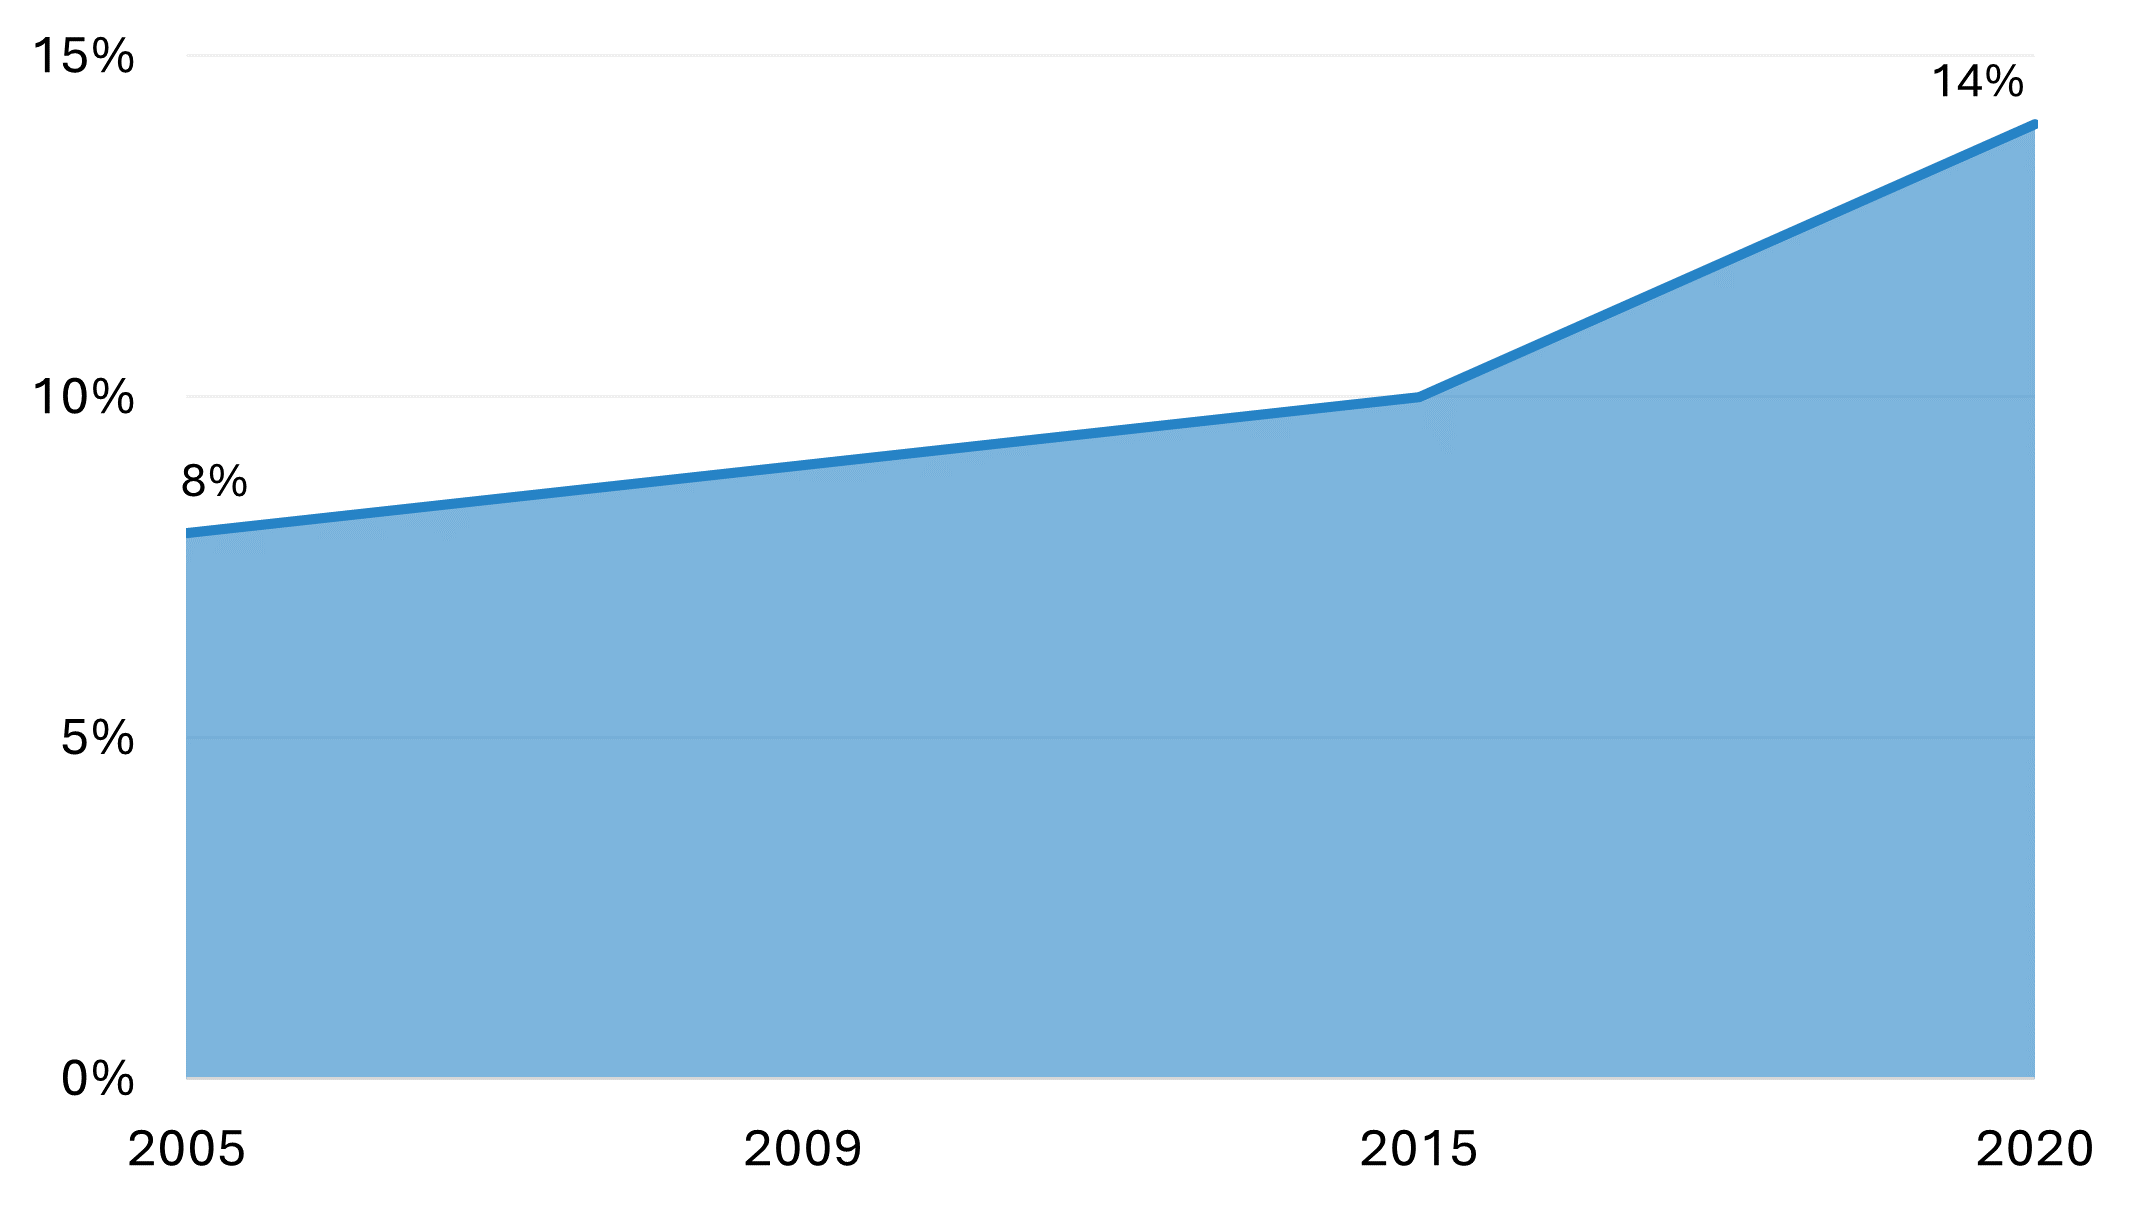
Source: Atlas Buildings Hub | Includes central (ducted) heat pumps and mini-splits.
Figure 3: Households with Heat Pumps as Main Space Heating Equipment by Region Between 2005 and 2020 (millions)
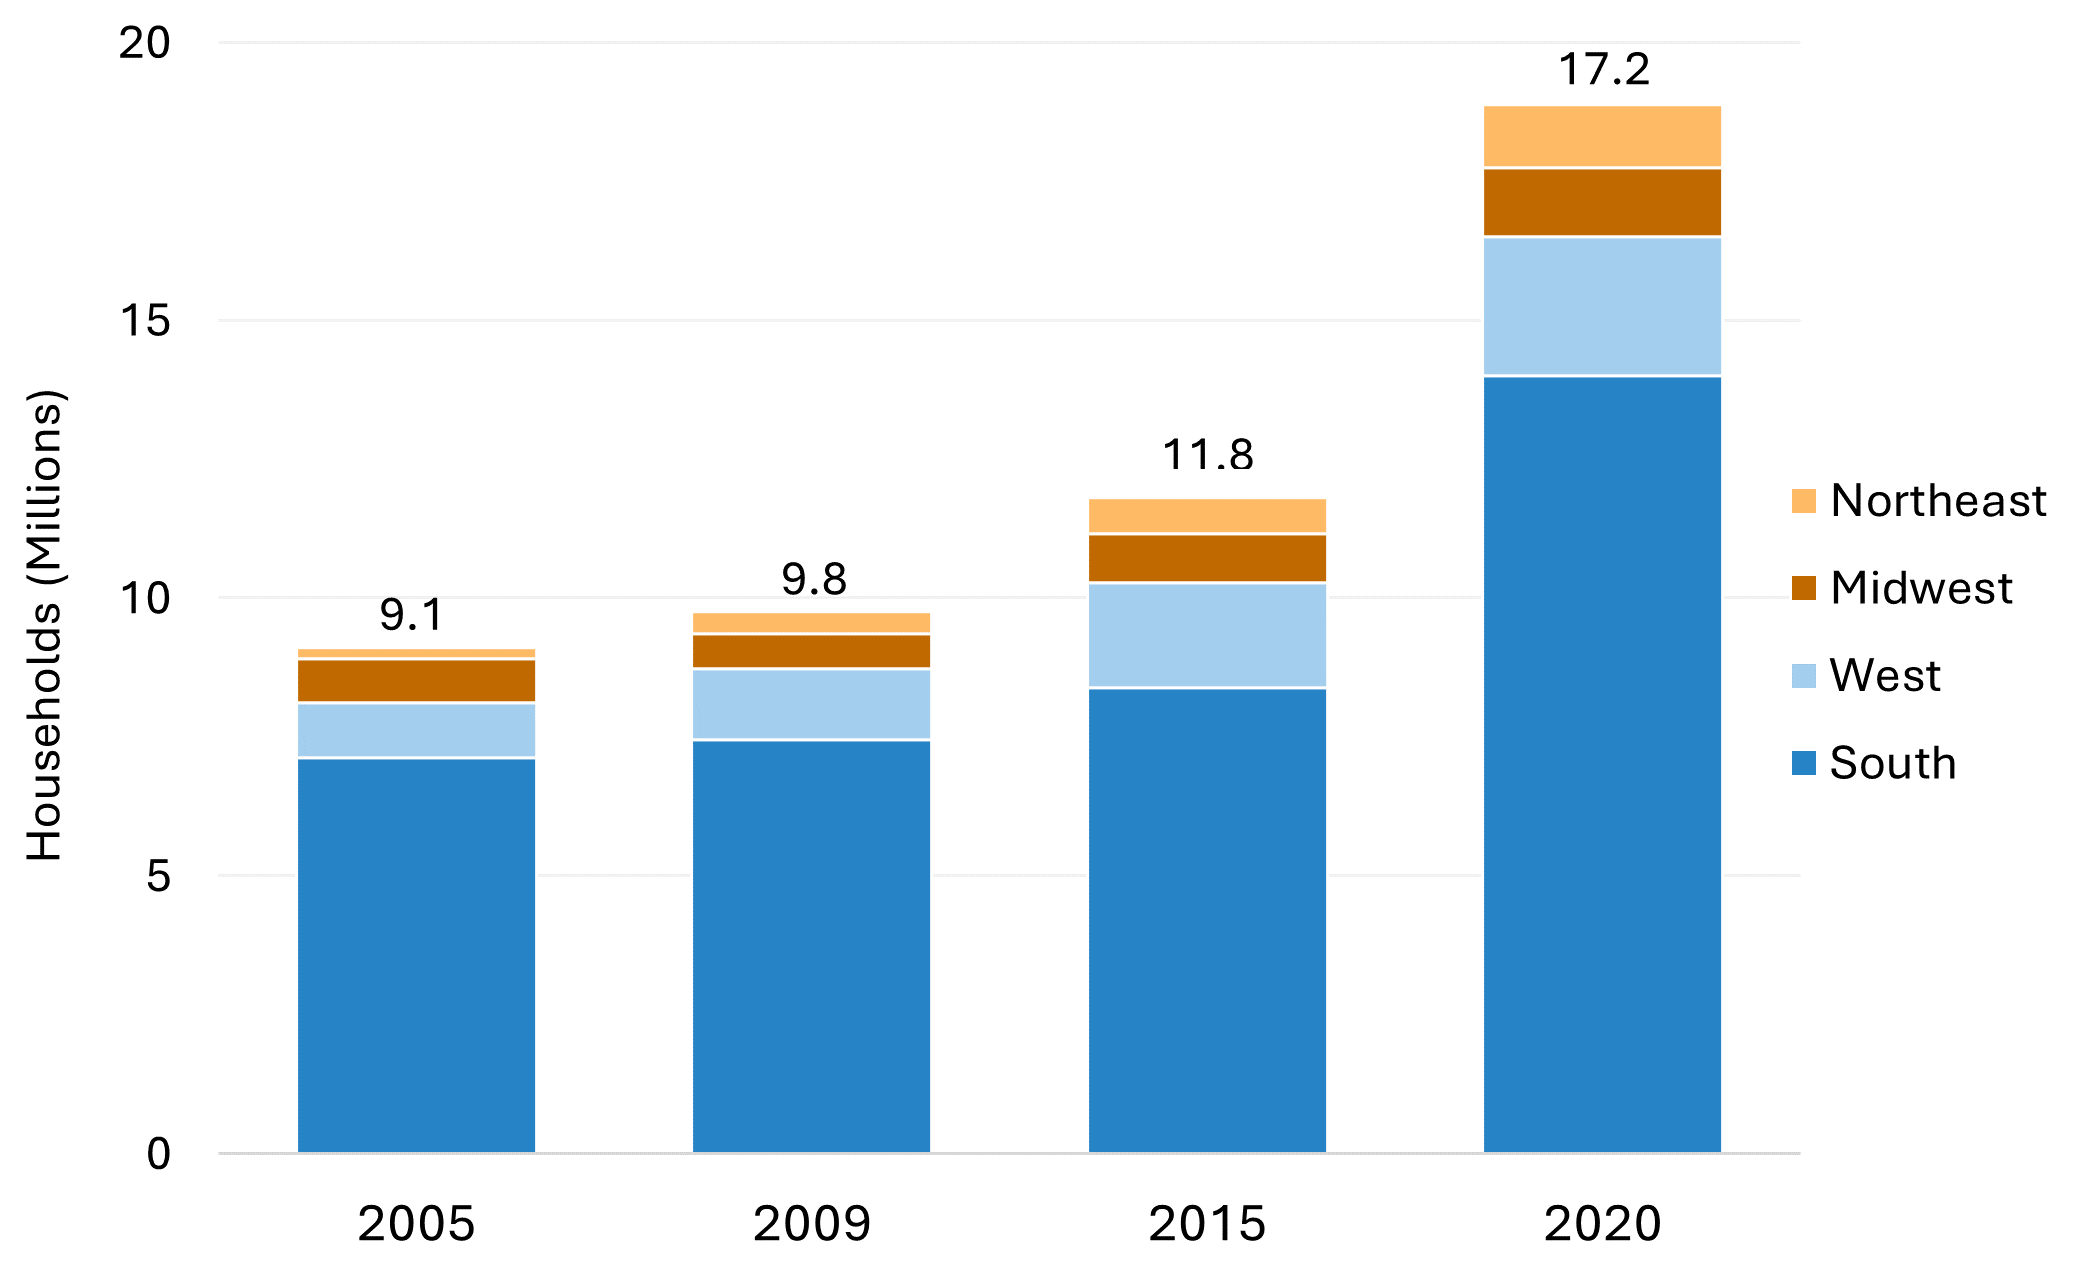
Source: Atlas Buildings Hub | Includes central (ducted) heat pumps and mini-splits.
Contrary to what you might anticipate, climate-forward states are relative laggards in terms of residential heat pump adoption. For example, only 4 percent of households in California, New York, and Massachusetts relied on heat pumps for primary space heating. That stands in stark contrast to what we see across the South.
In looking at the share of state households with primary heat pumps, nearly all of those in the top ten, with the exception of Arizona, are Southern states (Figure 4). Taking the top spot is South Carolina, where 42 percent of households report having a primary heat pump, followed by Alabama (39 percent), North Carolina (39 percent), and Tennessee (36 percent).
Reasons for the disproportionate rate of heat pump adoption in the South are varied, but it can likely be attributed to cheaper electricity prices, low levels of heating demand, and less developed gas pipeline infrastructure (related to the former reasons). Energy demand in the South comes largely from cooling needs, so in lieu of installing a central air conditioner, many people likely opt for a more efficient heat pump.
Figure 4: Share of State Households with Primary Heat Pumps for Space Heating (2020)
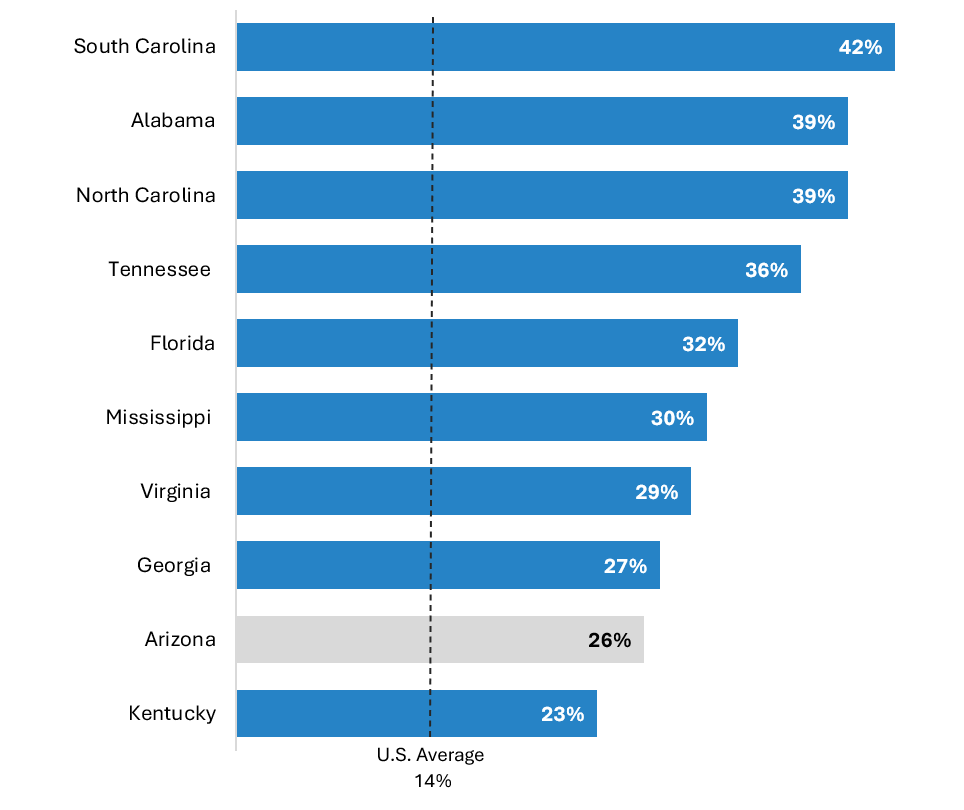
Source: Atlas Buildings Hub | Includes central (ducted) heat pumps and mini-splits.
To achieve our building decarbonization goals, the pace of heat pump adoption must quicken. But in recent years, the data shows that the tide is turning. According to Buildings Hub, 2022 was the first year central air source heat pumps outcompeted fossil furnaces in terms of total shipments (a proxy for sales). That gap in distribution has only continued to widen throughout the first half of 2023, where heat pumps have made up 57 percent of appliance sales across both categories (Figure 5). Looking to the future, federal heat pump rebate programs and new and expanded tax credit opportunities are likely to spur additional heat pump deployment and lead us to a market inflection point.
Figure 5: HVAC Appliance Shipments Over Time, by Product Type (January 2013 – June 2023)
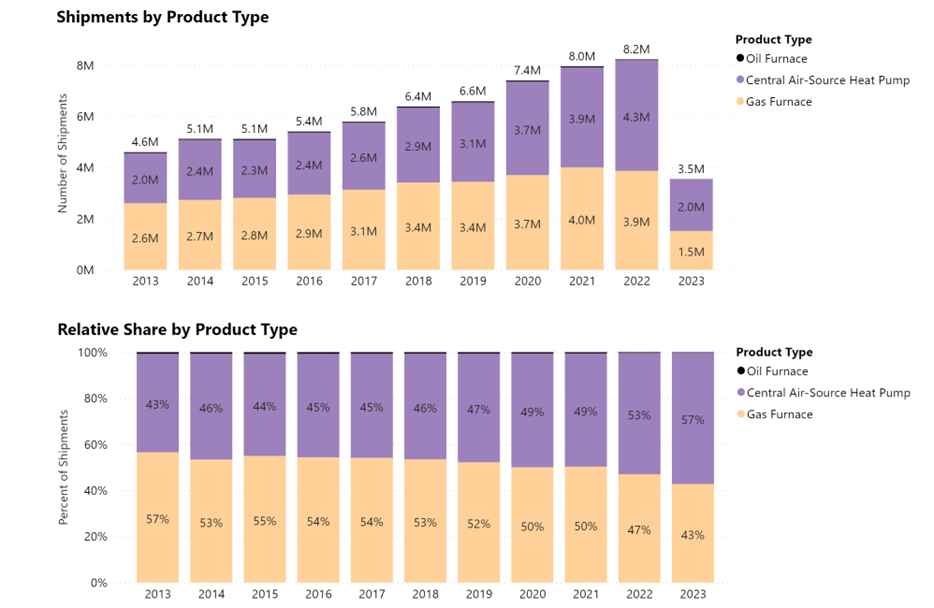
Source: Atlas Buildings Hub Appliance Shipments Dashboard | Air Conditioning, Heating, and Refrigeration Institute (AHRI).